Cardiovascular Flow Analysis Parameters
Analysis Parameters
Overview
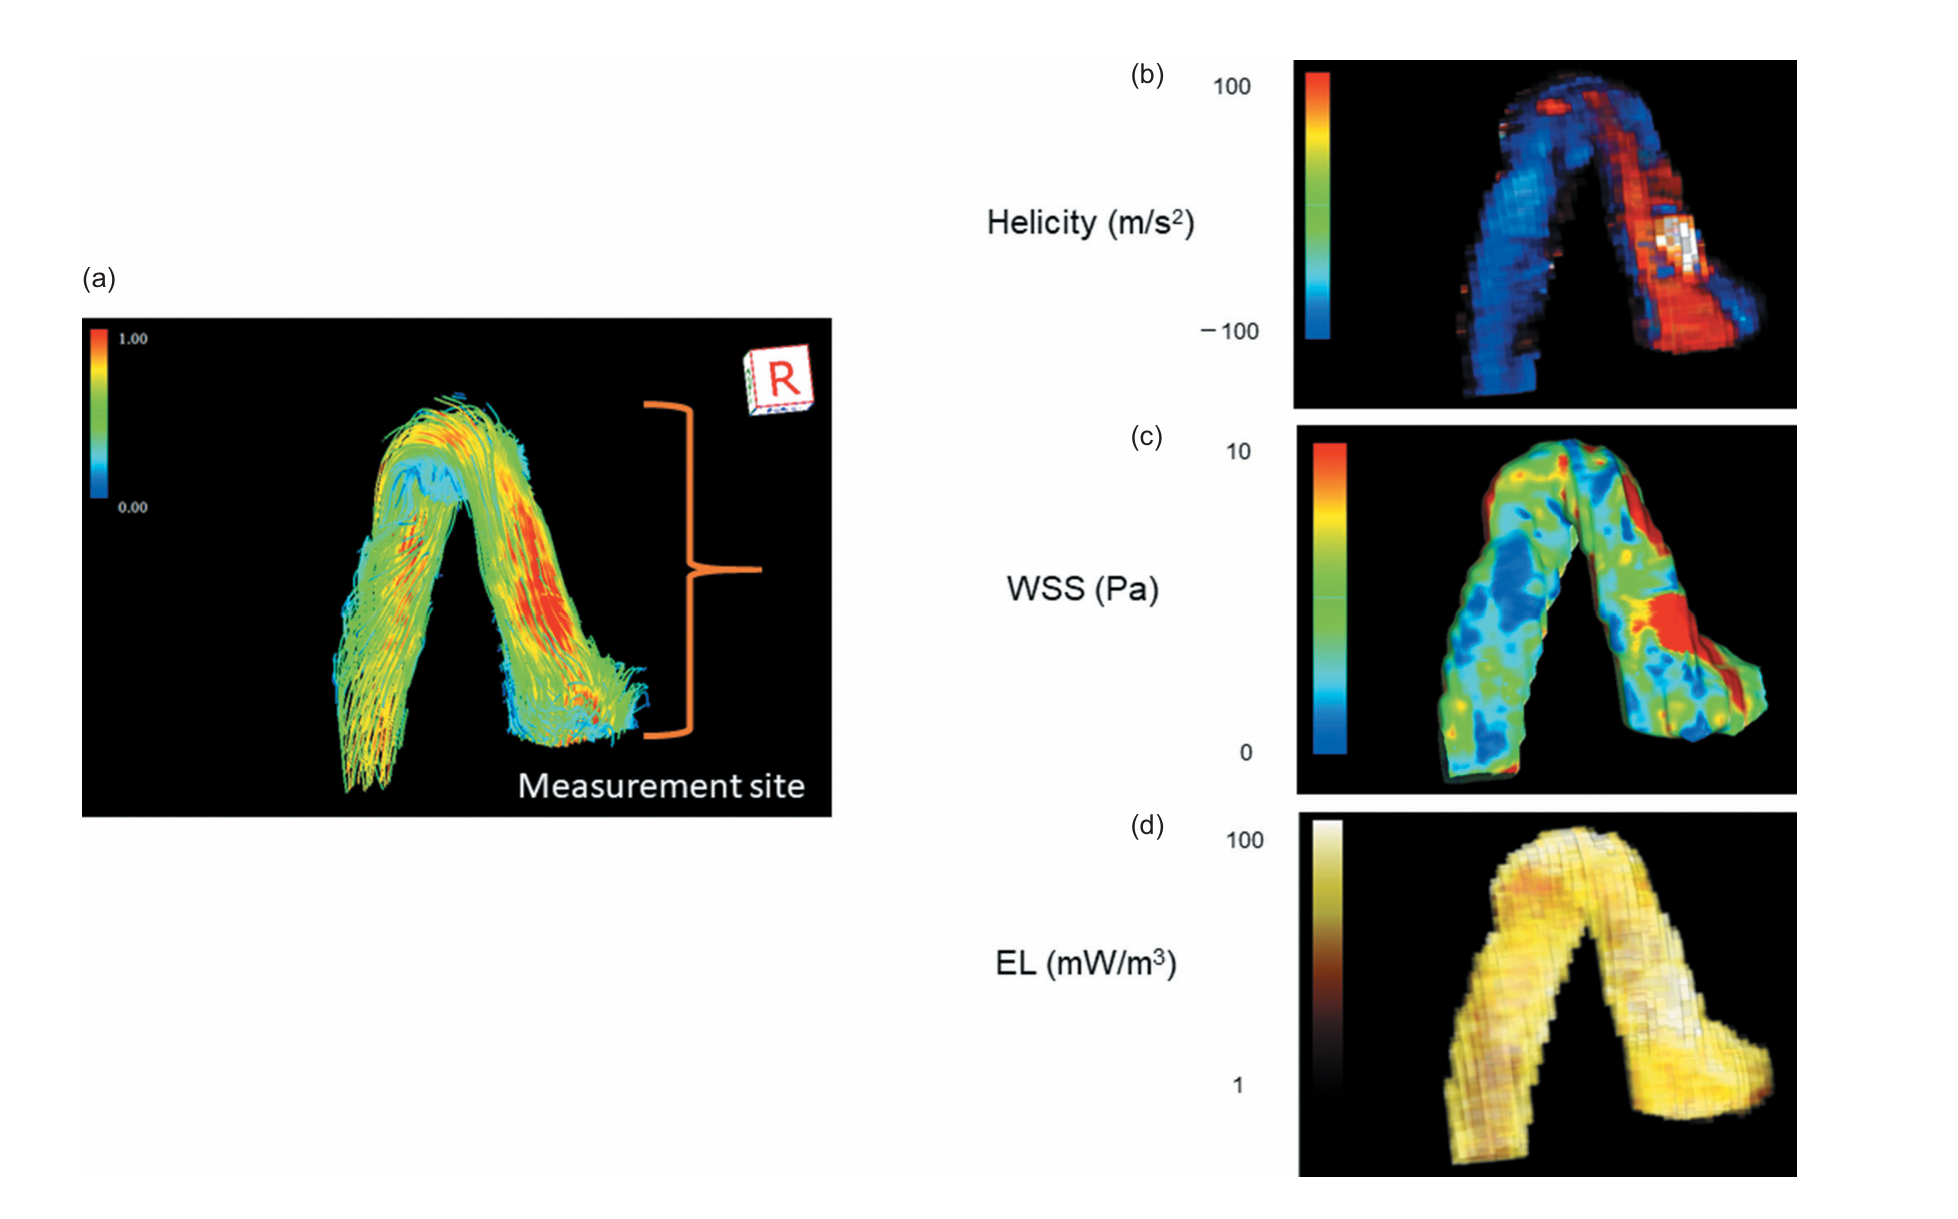
Energy Loss
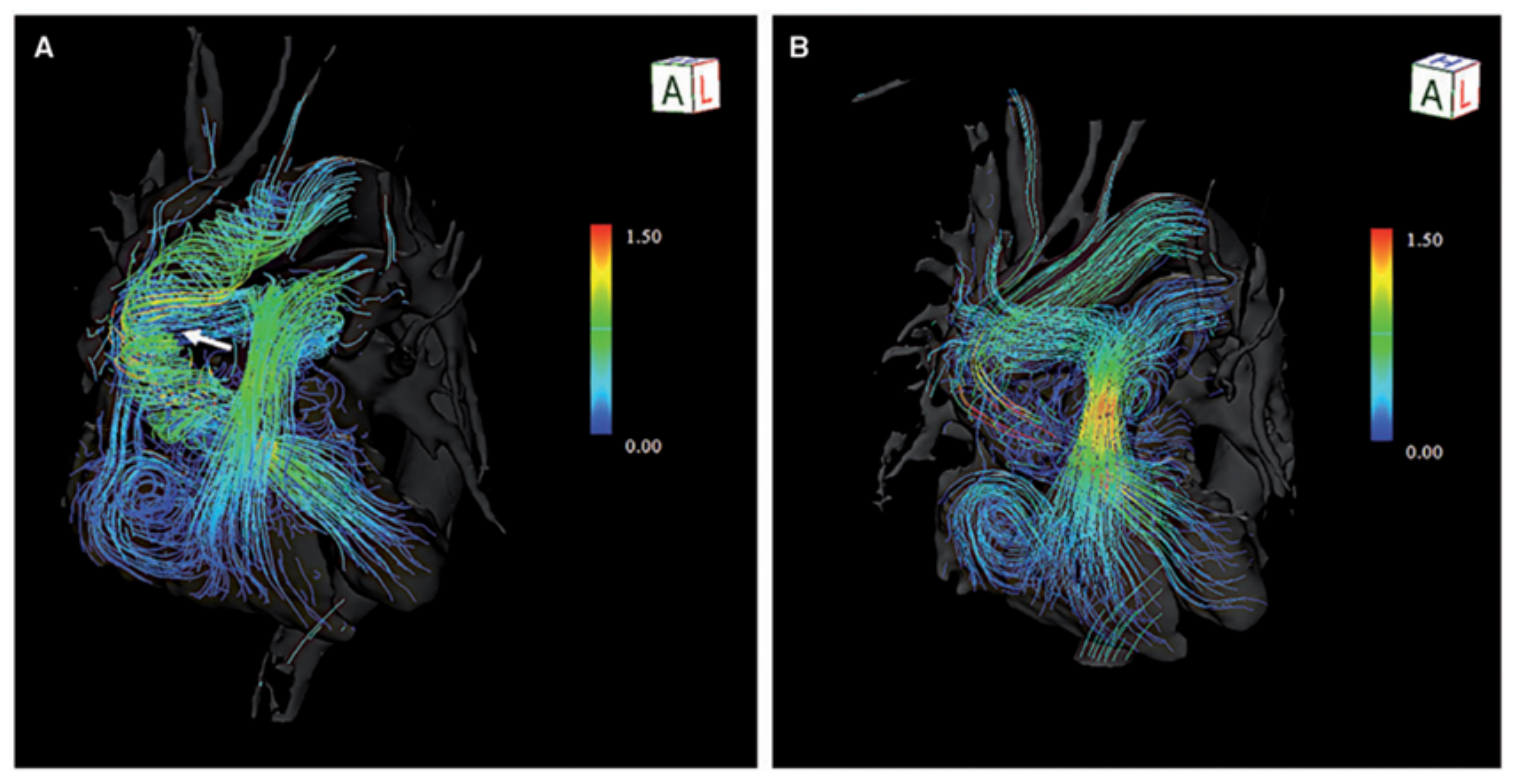
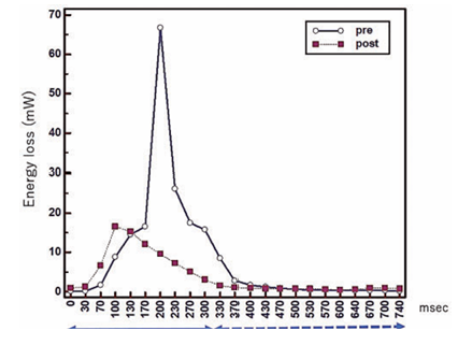
Energy loss refers to the dissipation of energy that occurs when blood, a viscous fluid, does not flow smoothly.
This dissipation is caused by conflicted flow within the blood stream, described scientifically as "vorticities and helicities" (meaning swirling, turbulent, or helical patterns). When the blood movement is inefficient or turbulent, the useful energy that should propel the blood forward is essentially wasted.
Advanced imaging tools, such as four-dimensional flow cardiac magnetic resonance (4D flow CMR), allow this energy loss to be quantified. For example, a successful surgical correction resulted in the estimated energy loss dropping from 4.3 mJ/cardiac cycle to 2.9 mJ/cardiac cycle, indicating that the flow had become more efficient and less destructive.
Figure analysis
The concepts discussed here are explored in depth in this article.
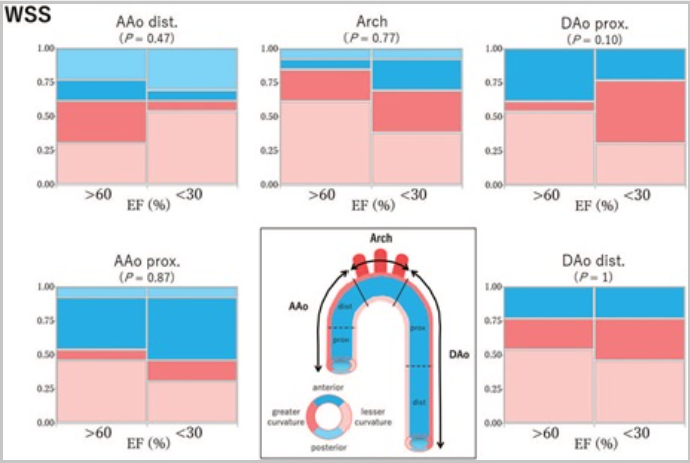
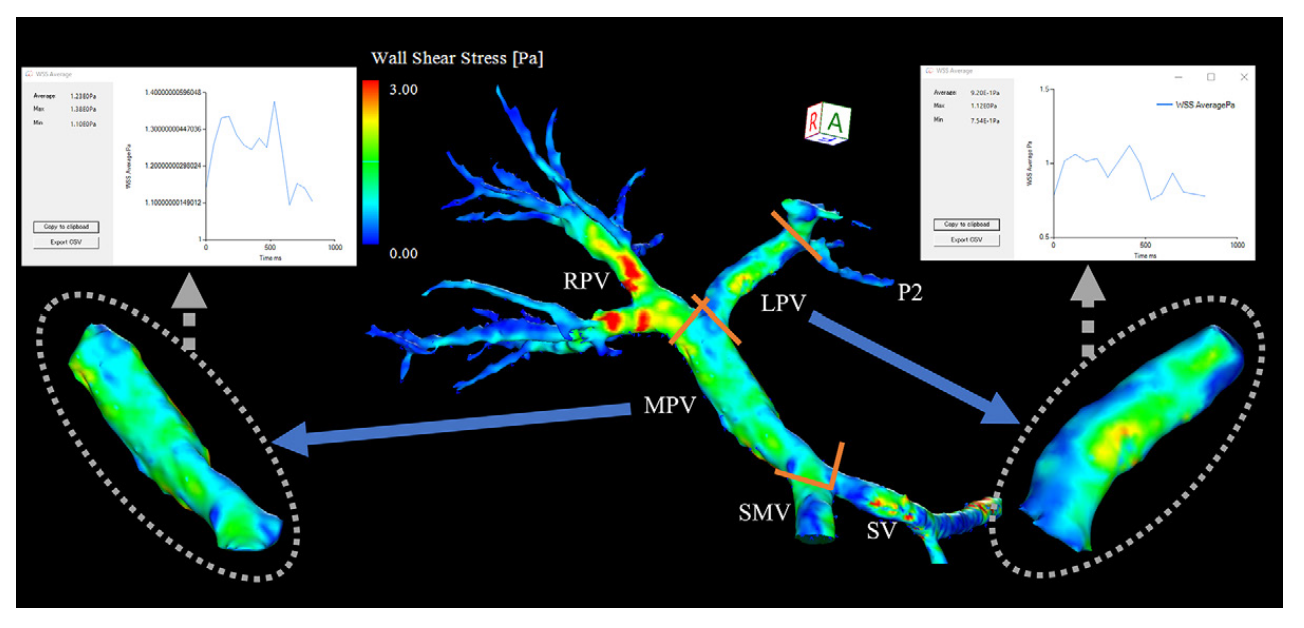
WSS (Wall Shear Stress)
Wall Shear Stress (WSS) measures how much friction the flowing blood applies to the inner lining of blood vessels, which is made up of endothelial cells. When blood flow becomes turbulent or irregular, such as in high-velocity jets or swirling vortex and helical patterns, the stress on the vessel walls increases.
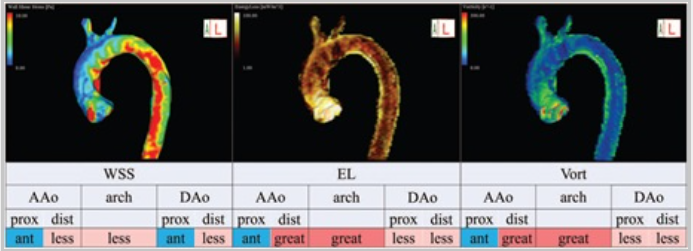
Blue areas: Low shear stress — blood applies less frictional force.
Visual representation
Streamline
Streamlines “Are lines representing the direction of the blood flow showcasing flow acceleration or deceleration through color contrast. The structure of vortex flow or flow collision can also be visualized. Beneficial to visualize flow characteristics at stenosed regions or near the valves”
Visualisation
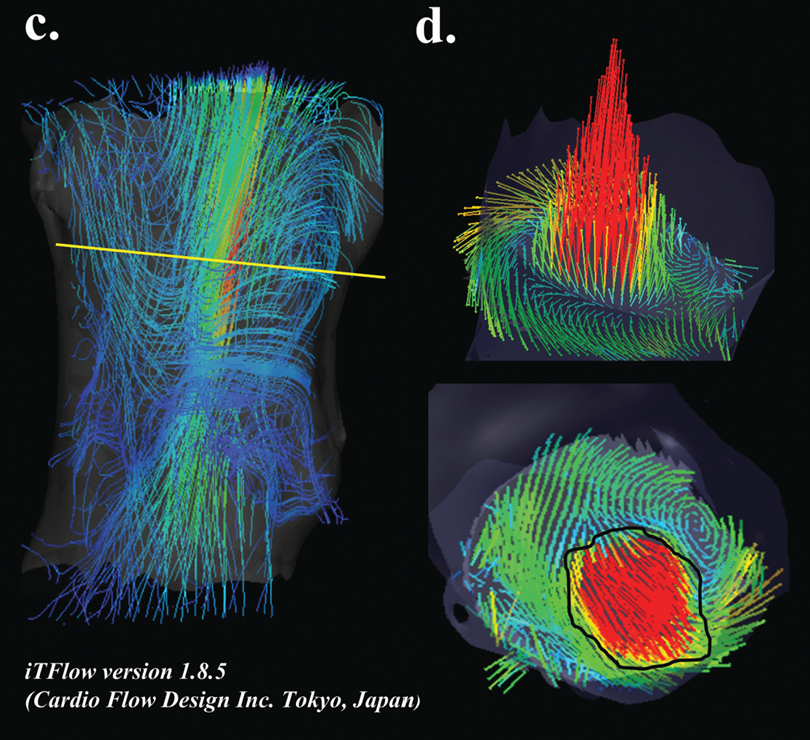
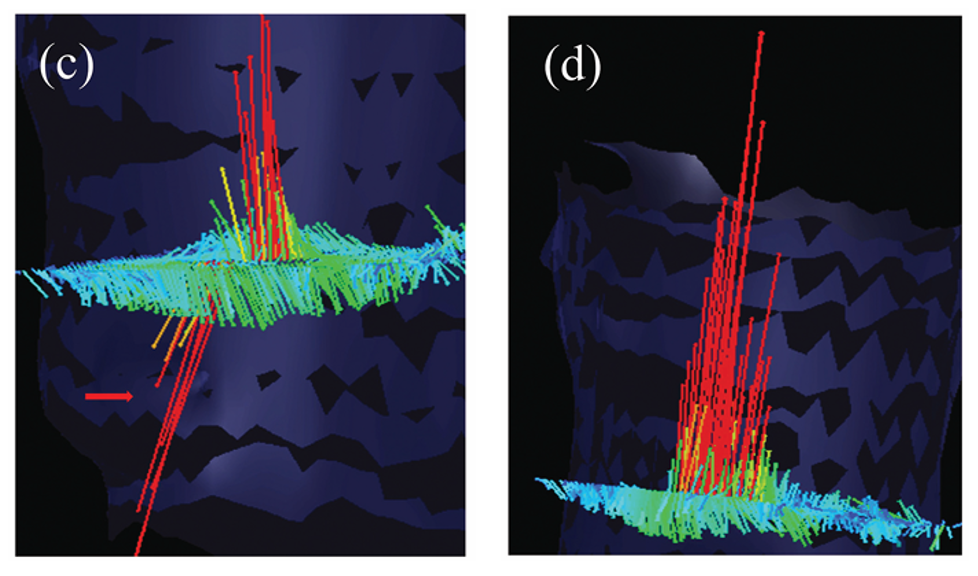
The long, continuous lines represent streamlines, tracing the path taken during systole.
The color scale indicates velocity:
- Red/yellow = high-speed flow
- Green/blue = intermediate or slower flow.
The red/yellow streamlines form a narrow, tall jet, indicating:
- High acceleration
- A concentrated flow column through the stenotic region
- The transition from red → yellow → green shows how velocity decreases as blood disperses downstream.
Colouring consistent with the explanation from C.
Pathlines
In simple terms, a pathline is an imaginary line that traces the complete, true path traveled by a single particle of fluid (in this case, blood) over a specific period of time. If we imagine tracking a single red blood cell as it moves through the heart, the pathline is the precise line drawn through space that tracks its movement from beginning to end. pathlines are generated by sophisticated software that processes four-dimensional flow magnetic resonance imaging (4D-flow MRI) data, often using mathematical techniques.
Uses for pathlines
To explore how iTFlow uses 4D-flow MRI pathlines to track cardiac blood flow and quantify hemodynamic inefficiency, see the full paper here.
Helicity
Helicity is the local strength of the helical motion of blood flow. In simple terms, helicity measures how intensely blood flow is twisting or spiraling as it travels. Helicity is a key indicator of flow efficiency. While healthy blood flow often has a gentle spiral, excessive helicity contributes to conflicted blood flow. This conflicted flow, along with vorticity (swirling), generates friction within the blood, resulting in a quantifiable metric known as Energy Loss (EL).
Understanding Helicity in Blood Flow
Relative to the paper
To investigate the flow dynamics underlying cardiac inefficiency such as abnormal swirling motions (vortices) and increased energy loss (EL) arising from non physiological blood flow patterns please consult the PDF.
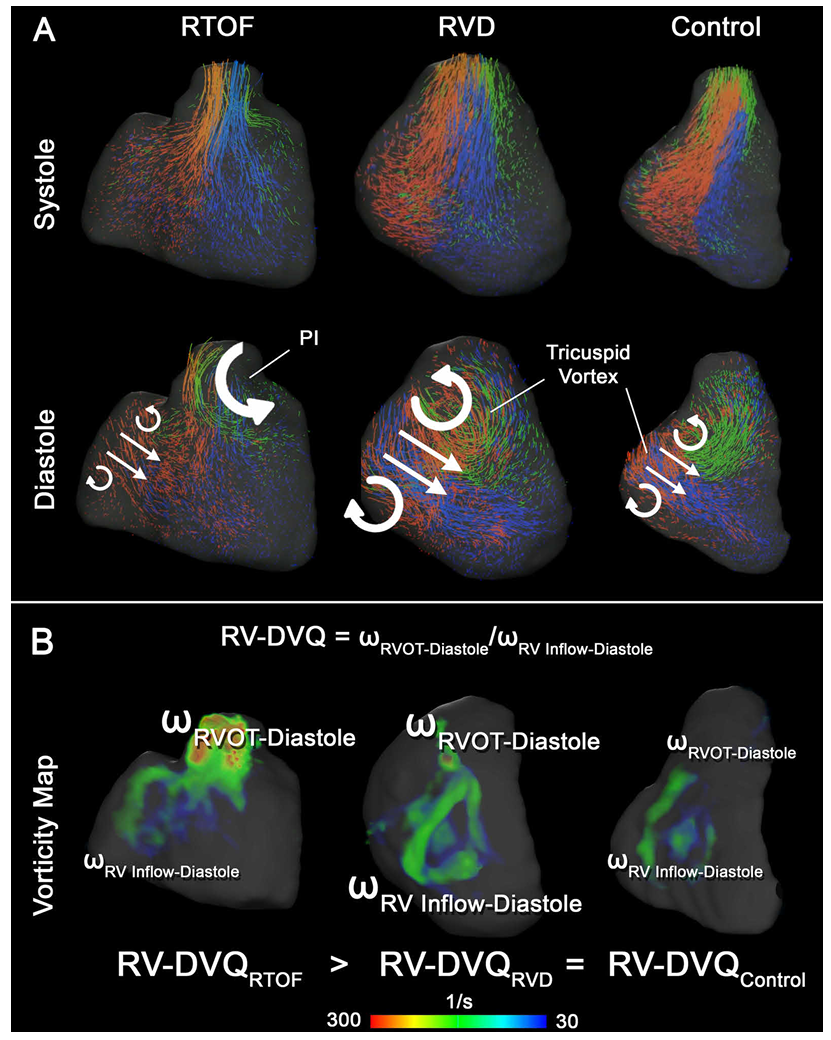
Vorticity
Vorticity (ω) is a fluid dynamics concept that describes the local spinning motion of blood. It represents the magnitude and axial direction of the spinning within the flow. It is mathematically defined as the curl of the Velocity field. vorticity measures how much the blood is locally swirling, churning, or rotating around an axis as it moves.
Visual Representation of Helicity and Vorticity
Normal vs Abnormal Right Ventricular Flow
Relative to the paper
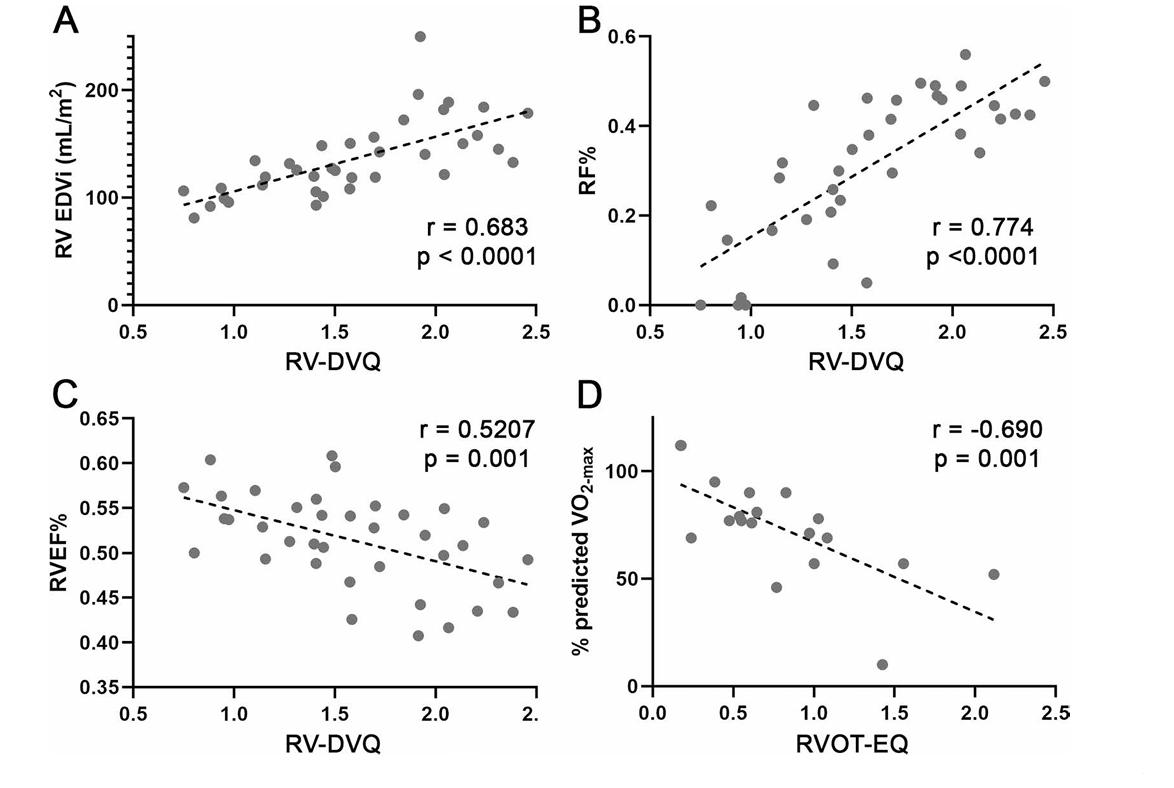
Temporal vorticity Patterns
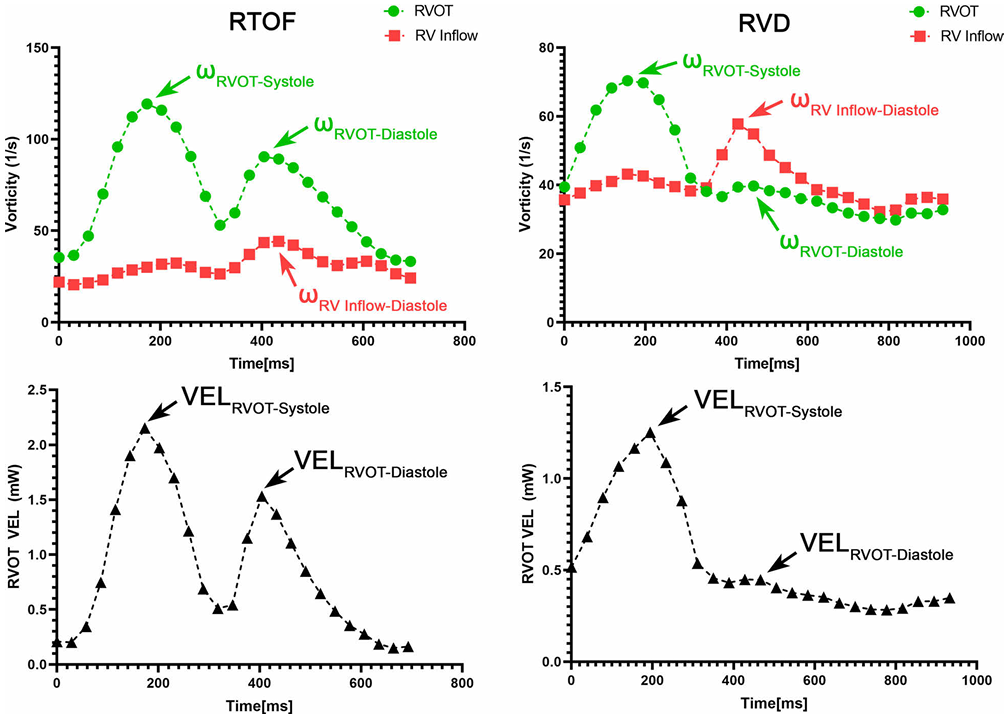
To explore how abnormal vorticity and helicity relate to right ventricular dysfunction and reduced exercise capacity in repaired Tetralogy of Fallot, please refer to the full paper (PDF).
AFI (Aneurysm Formation Indicator)
AFI is a hemodynamic metric used to identify regions of blood flow stagnation and abnormal wall shear stress (WSS) behavior in blood vessels. It was proposed by Mantha et al. (2006) to determine where an aneurysm is likely to form or how an aneurysm may behave over the cardiac cycle.
More specifically
Relation to the heart
For more details on AFI and its hemodynamic basis, click here to view the full paper.
Oscillatory Shear Index (OSI)
The Oscillatory Shear Index (OSI) is an important hemodynamic parameter used to assess the quality and stability of blood flow within vessels. It describes the temporal variation in Wall Shear Stress (WSS), indicating how much the direction of shear stress changes over the cardiac cycle (WSS is explained in the earlier section). OSI measures how frequently and to what extent shear stress reverses direction during the cardiac cycle. Low OSI values indicate stable, unidirectional flow, whereas high OSI values reflect disturbed or oscillatory flow patterns. Together, OSI, WSS, and Energy Loss (EL) provide a comprehensive description of the hemodynamic environment within blood vessels.
OSI Visualisation Before and After Treatment
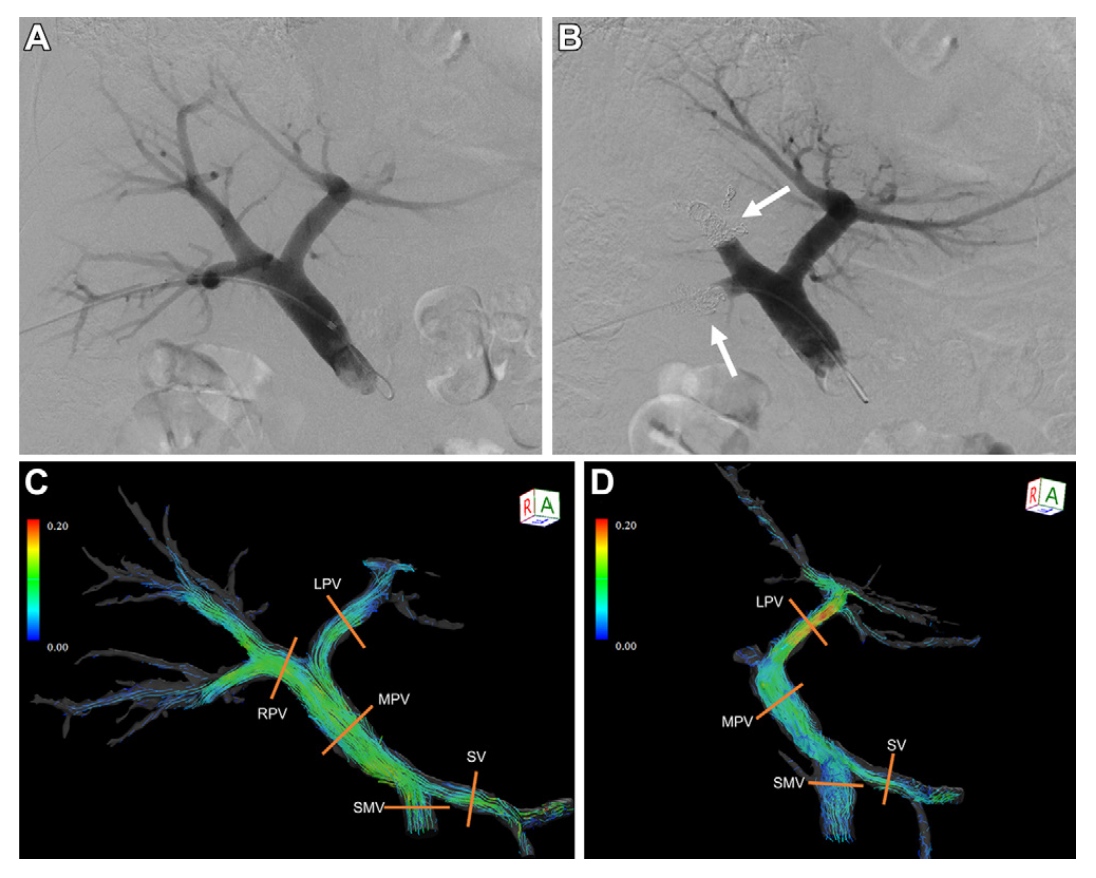
Detailed OSI Mapping Across the Portal Venous Branches
Clinical relevance of OSI
- Main Portal Vein (MPV): OSI increased after intervention, indicating more disturbed and oscillatory flow.
- Left Portal Vein (LPV): OSI decreased, suggesting a shift toward more stable and directed flow.
(RRT) Relative Residence Time
Relative Residence Time (RRT) reflects how long blood stays near the vessel wall and is closely tied to flow stagnation. It combines information from both Wall Shear Stress (WSS) and the Oscillatory Shear Index (OSI) to show where blood moves slowly or changes direction frequently, conditions that reduce the “washing” effect of shear on the vessel lining. High RRT values indicate prolonged contact of blood with the wall, which can promote endothelial dysfunction, plaque development, and aneurysm progression. Like OSI and WSS, RRT is an important hemodynamic metric for identifying areas of unhealthy or disturbed blood flow within vessels.
Relation to blood flow
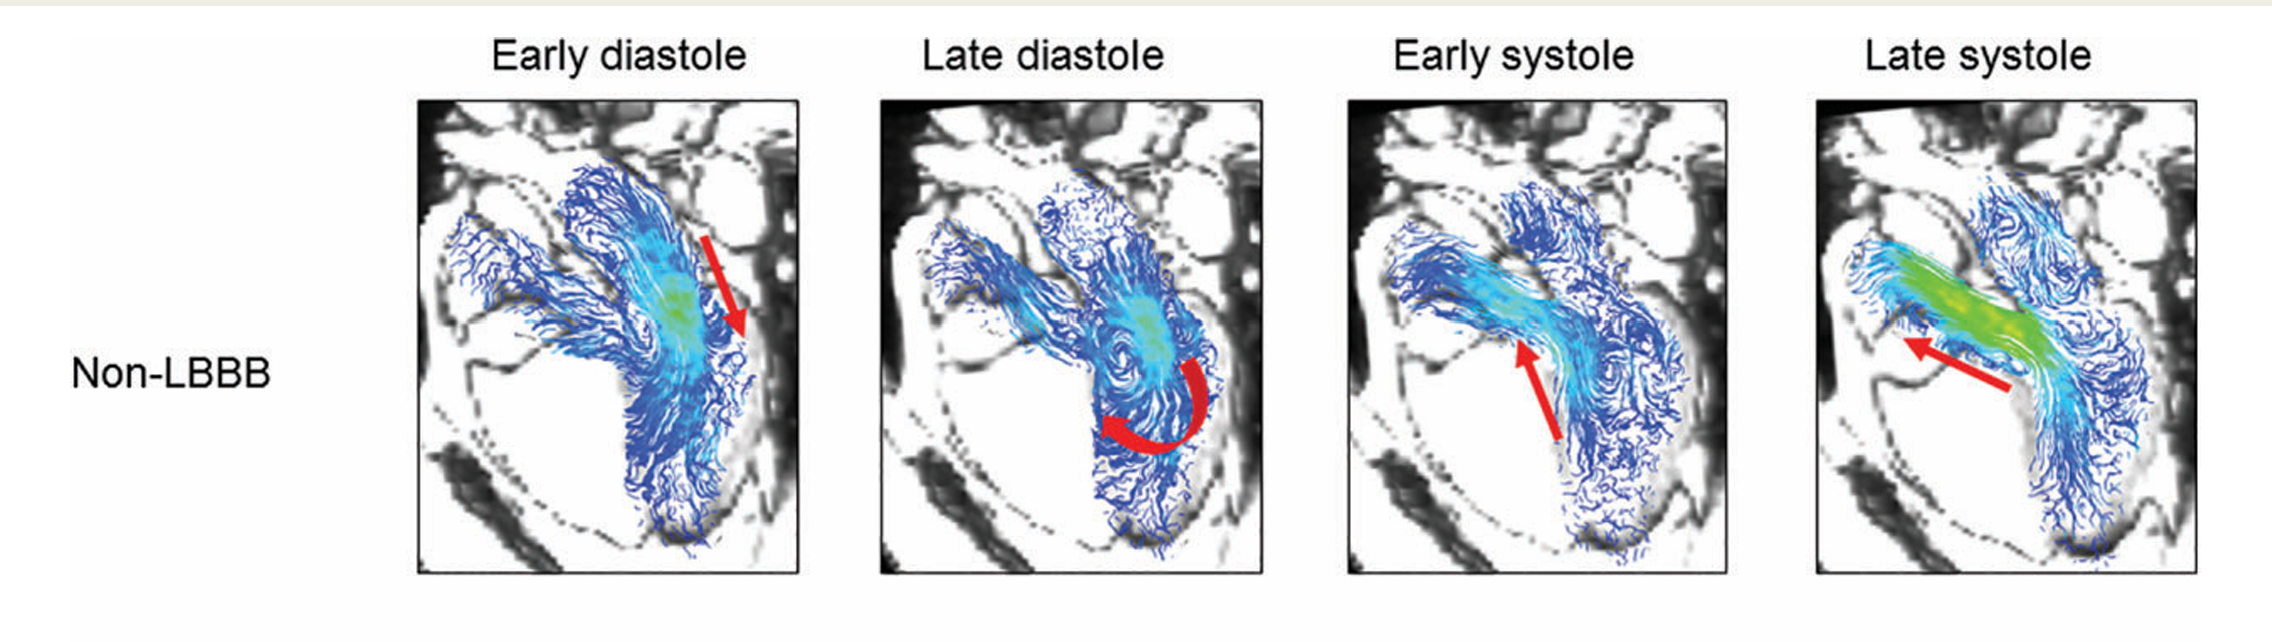
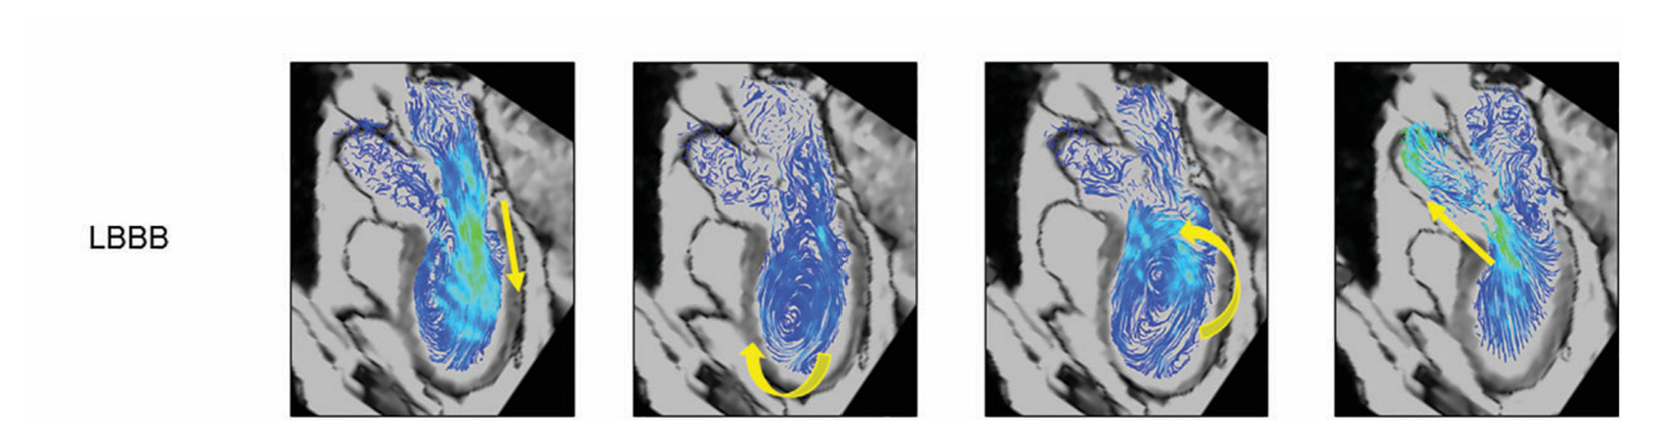
Motion Tracking
Flow Motion Tracking is the process of visually and quantitatively tracking the movement of blood as it travels through the heart and major vessels over time. This detailed tracking is essential because complex cardiovascular diseases, such as repaired Tetralogy of Fallot (rTOF), create abnormal or turbulent flow patterns that are not clarified by conventional measurements.
Right-Ventricular Motion Segmentation
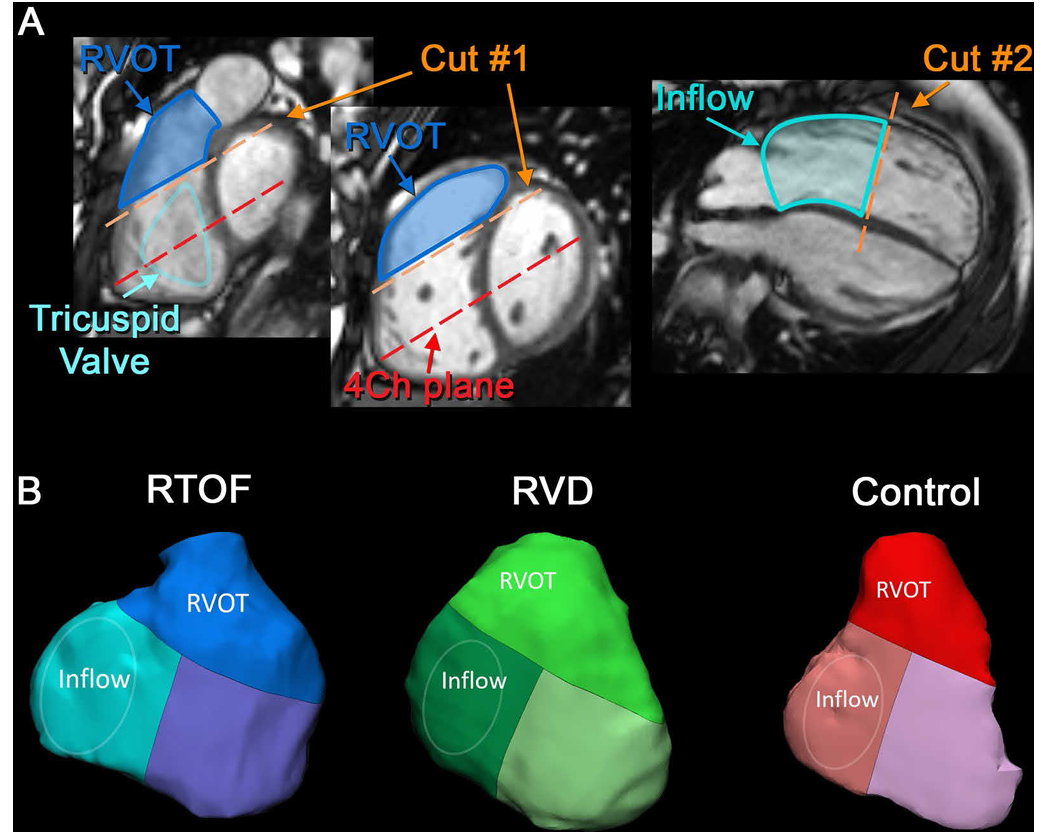
The first set of images shows how motion tracking begins with precisely defining the anatomical regions that contribute to right-ventricular (RV) function.
Using cine MRI slices, the RV is separated into two functional zones:
Influx region (Inflow) — where blood enters through the tricuspid valve.
Outflow region (RVOT) — where blood exits toward the pulmonary artery.
The orange “Cut #1” and “Cut #2” lines illustrate how the system slices through the heart to isolate motion in each region.
This segmentation stage is essential because it allows the software to track movements of each part independently, quantify motion patterns, and compare how the RV deforms during the cardiac cycle.
Motion tracking then assigns each region a distinct 3D geometry, forming the basis of the models shown in Panel B.
Particle Tracking and Flow Abnormalities
Clinical Relevance of Motion Tracking
PCA (Peak Centerline Acceleration)
PCA measures the intensity of blood flow velocity along the centerline of a vessel, typically obtained from MRI. It reflects how quickly blood accelerates during the cardiac cycle, capturing the dynamic effects of the heart’s pumping. Higher PCA values indicate faster, more forceful blood flow, while lower values suggest slower or weaker flow. By analyzing PCA, clinicians and engineers can assess how the heart’s output interacts with vessel geometry, detect regions of abnormal flow, and better understand areas at risk of vascular disease.
Relevance to iTFlow
Valve tracking
Valve Tracking is a specialized, semiautomated technique used in advanced cardiac magnetic resonance (CMR) analysis, specifically drawing on data acquired from Four-dimensional (4D) flow studies. Its primary function is to accurately measure the velocity and characteristics of blood flow as it enters the heart’s ventricle, focusing on the interface of the atrioventricular valve. Valve tracking provides crucial metrics that characterize diastolic filling. Specifically, the technique measures the atrioventricular peak inflow velocity (E-wave) and the inflow velocity at end-diastole (A-wave), both quantified in centimeters per second (cm/s).
Valve Tracking and Energetic Cost of Blood Flow
Detailed OSI Mapping Across the Portal Venous Branches
The anatomical panels (A) show precise tracking of the atrium, systemic venous pathway, and single-ventricle (SCPC) pathway. By accurately identifying valve position and chamber boundaries over time, the software can compute how blood accelerates and decelerates as valves open and close.
The kinetic energy plot (B) demonstrates a sharp rise during systole, when the valve opens and blood is forcefully ejected, followed by a smaller diastolic peak as the chamber refills. Complementing this, the viscous energy loss curve (C) highlights how inefficient flow patterns around the valve generate energy dissipation. Systole yields the highest loss due to rapid, valve-driven flow acceleration, while diastolic losses remain lower and more gradual.
Energy Loss Caused by Valve Regurgitation
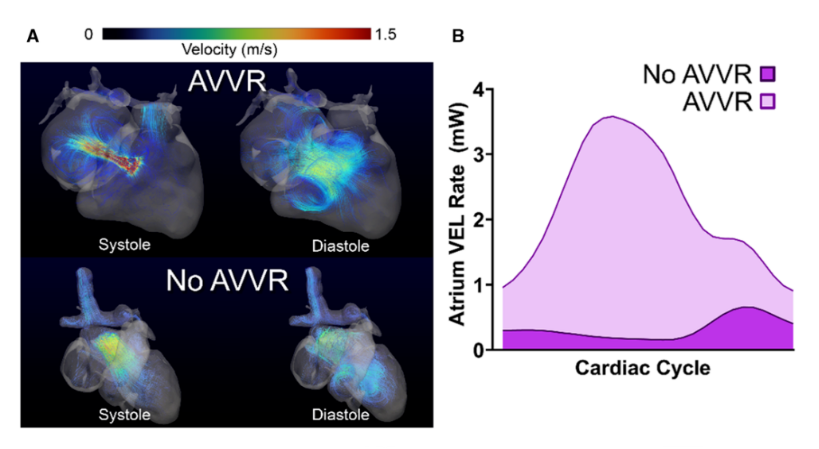
In the AVVR images (A), high-velocity jets appear during systole as blood abnormally leaks backward through the valve. This produces turbulent, disorganized flow patterns that persist into diastole. In contrast, the “No AVVR” case displays more streamlined flow with clean forward ejection and smooth filling, consistent with normal valve closure.
The energy loss curves (B) quantify this difference: Patients with AVVR show dramatically elevated viscous energy loss (VEL) across the cardiac cycle, reflecting the mechanical inefficiency created by a leaking valve. Higher VEL corresponds to greater wasted energy and increased hemodynamic burden on the heart.
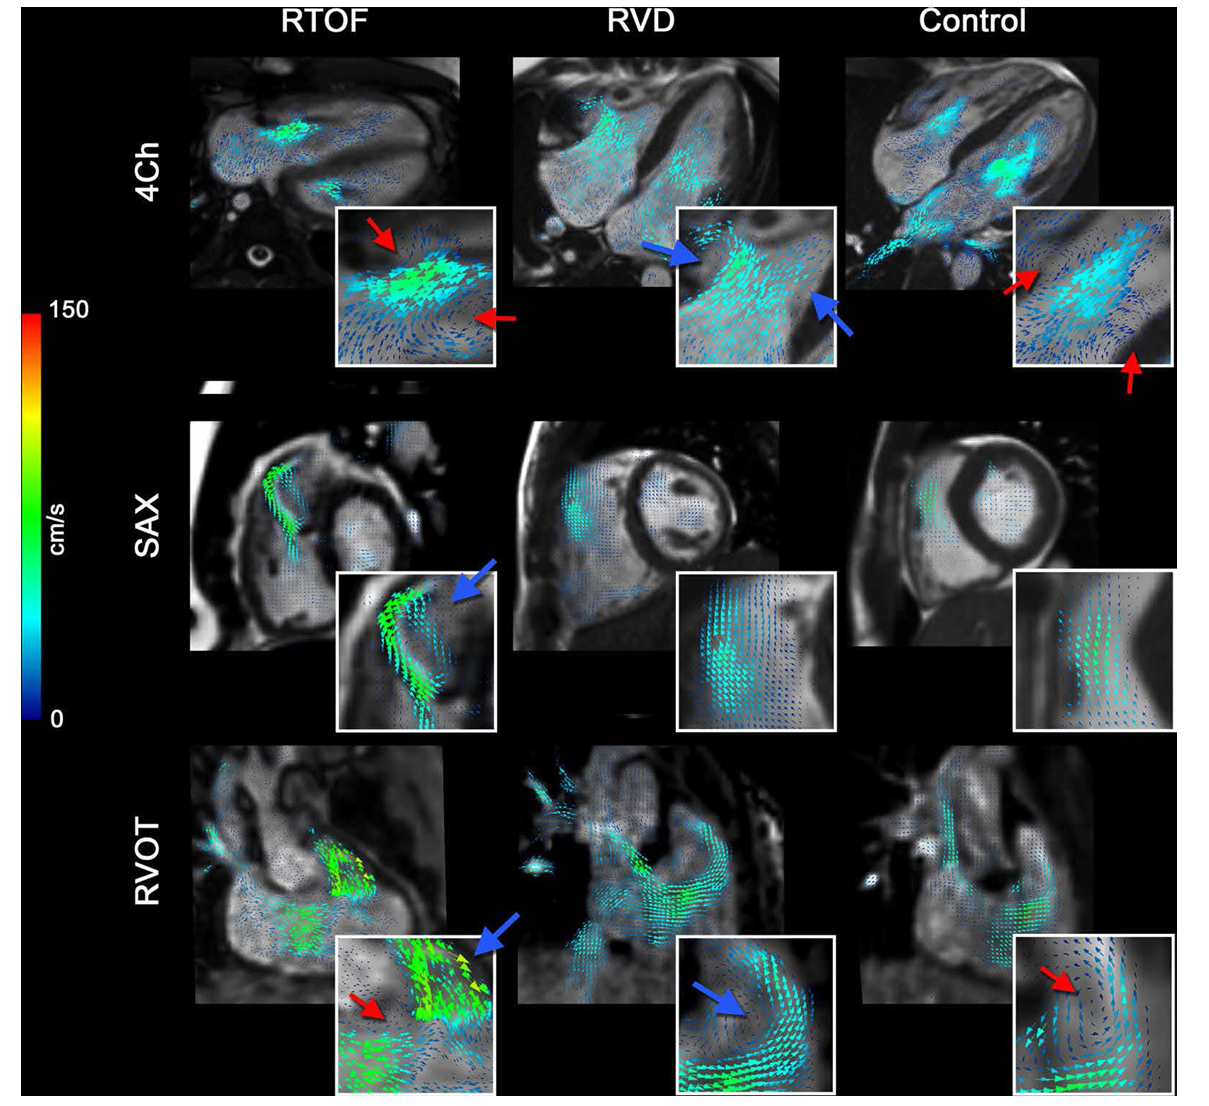
Vector Visualisation
Vector visualisation transforms advanced imaging data into three-dimensional (3D) representations of blood flow direction and velocity across the vascular system. This analysis is enabled by time-resolved three-dimensional phase-contrast imaging (4D-flow MRI), which captures full 3D flow velocity information throughout the cardiac cycle. Using dedicated flow analysis software, iTFlow, these data are post-processed to visualise blood flow vectors across the entire field of view. Flow behaviour is displayed using multiple visual formats, including 3D vector fields, streamlines, pathlines, and particle traces.
Interpreting Vector Visualisation
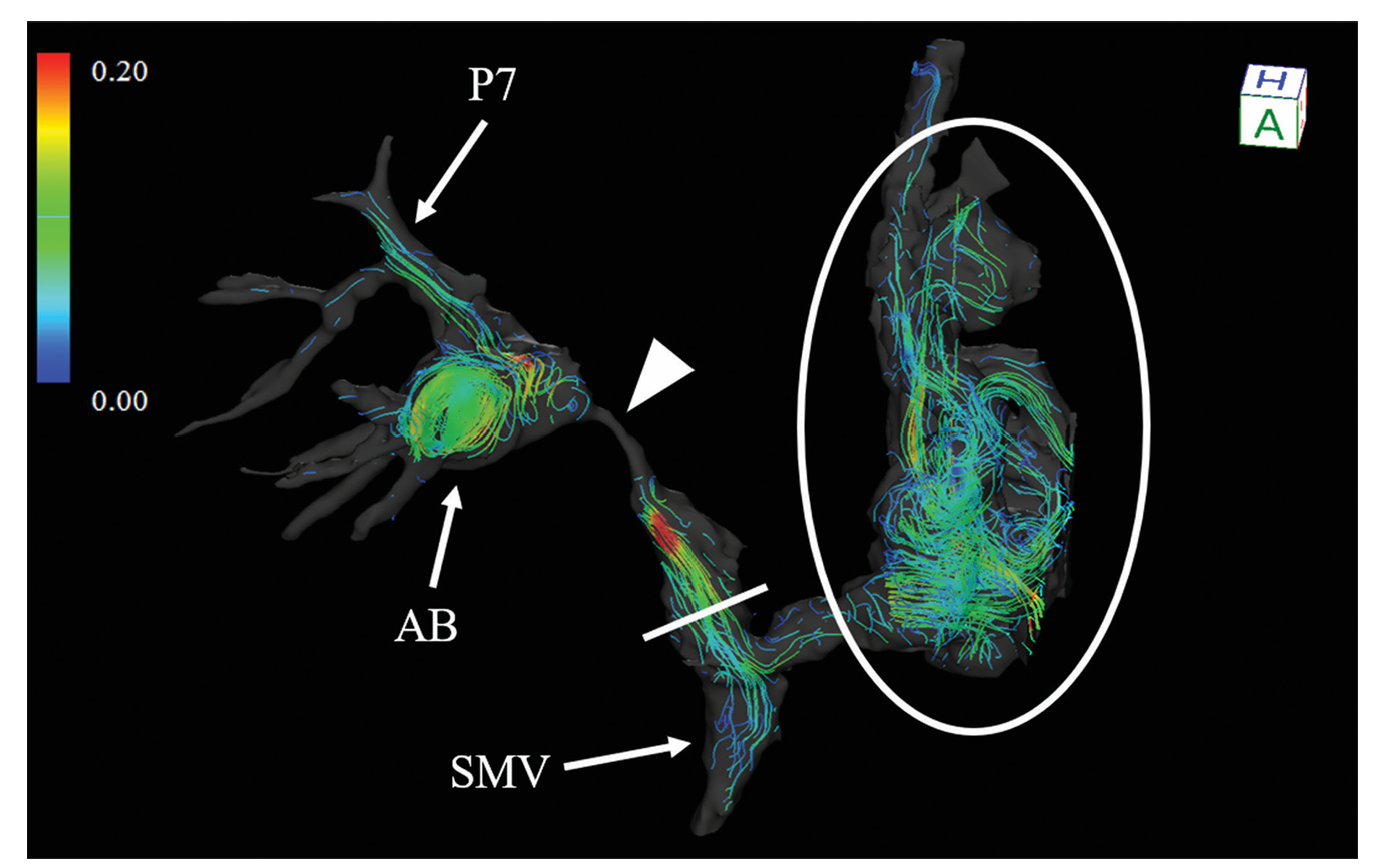
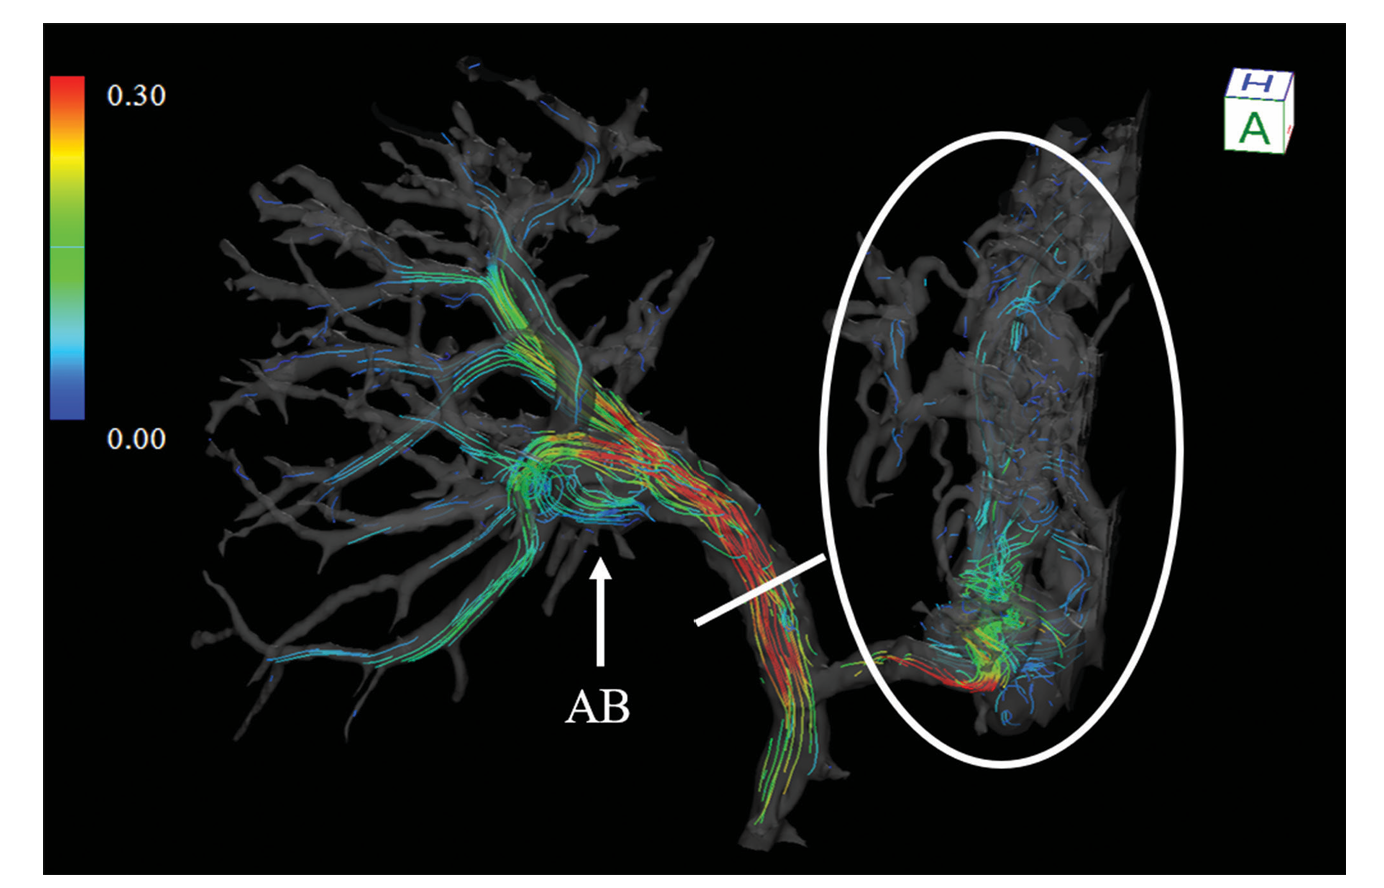
What you are seeing: Coloured lines represent blood flow through different vessels, showing both direction and speed.
Colour scale: Blue/green indicates slower blood flow, while yellow/red indicates faster flow.
Highlighted region: The circled area shows disturbed or chaotic flow with swirling patterns, which may indicate abnormal vessel behaviour or areas of clinical concern.
Anatomical labels: Labels such as AB, SMV, and P7 identify key vessel branches where these flow changes occur.
Wide-Field Vector Visualisation of Vascular Blood Flow
Relevance to the paper/blood flow
Key clinical benefits
3D flow understanding: Visualises full blood flow topology across complex vascular networks for detailed local hemodynamic assessment.
Detection of abnormal flow: Identifies compromised, reversed, vortex, or helical flow patterns associated with pathology.
Assessment of flow efficiency: Reveals uneven or reduced flow distribution caused by stenosis or vessel narrowing.
Treatment planning and evaluation: Confirms intervention success by demonstrating improved, more uniform, and laminar flow patterns.