Case Report
Hemodynamic Analysis of Microvascular Anastomosis Using Computational Fluid Dynamics (CFD)
Overview
In microvascular anastomosis for procedures such as free flap transfer, the selection of recipient vessels as well as the anastomotic site and technique (e.g., anastomosis between vessels with diameter mismatch) have a substantial impact on postoperative vascular patency and the risk of thrombosis.
In this study, computational fluid dynamics (CFD) was used to analyze the effects of sutures exposed to the vessel lumen on blood flow characteristics, including wall shear stress (WSS), streamline disturbance (SL), and oscillatory shear index (OSI).
PDF
In this study, computational fluid dynamics (CFD) was used to analyze the effects of sutures exposed to the vessel lumen on blood flow characteristics, including wall shear stress (WSS), streamline disturbance (SL), and oscillatory shear index (OSI).
Model and Analysis Setup
Model
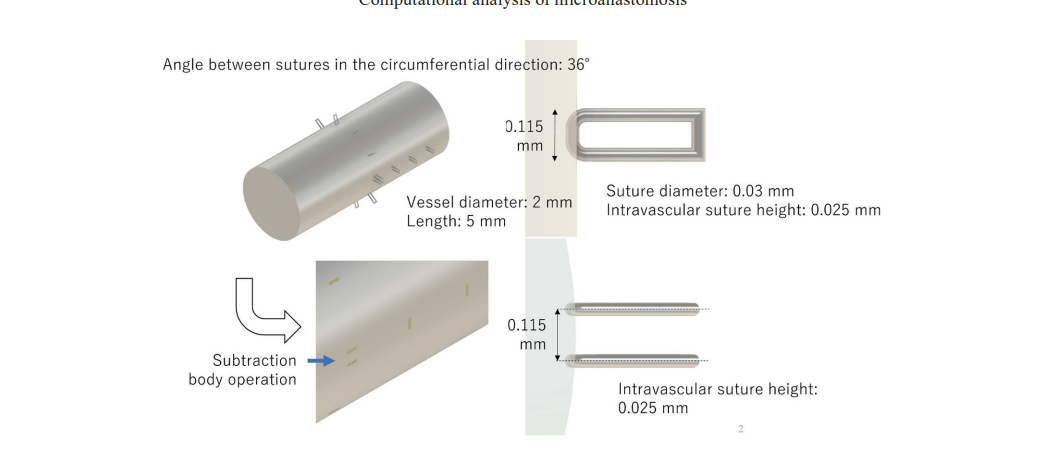
A microvascular anastomosis model was constructed using vessels with a diameter of 2 mm, assuming a tapered anastomotic technique to reproduce a diameter mismatch between connected vessels.Suture diameter: 0.03 mm
Number of sutures: 10 insertion points
Intraluminal suture exposure: Height: 0.025 mm, Length: 0.115 mm
On the outflow side, three sutures were arranged in series along the flow direction to evaluate flow disturbance.
Blood Flow Conditions
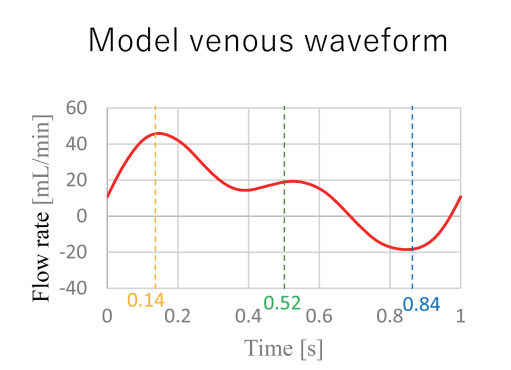
A venous pulsatile waveform was applied as the inlet condition.Flow rate: Maximum: 45.0 mL/min, Minimum: −19.0 mL/min, Mean: 13.0 mL/min
Cardiac cycle: 1.0s
CFD Calculation Conditions
Solver: OpenFOAM v5.0Blood properties: Density: 1,060 kg/m³, Viscosity: 0.004 Pa·s
Governing equations: The Navier–Stokes equations were numerically solved to obtain the flow field.
Visualization and Evaluation Parameters
Streamlines (SL): Used to evaluate flow pathways and the presence of flow disturbancesWall Shear Stress (WSS): Shear stress acting on the vessel wall
Oscillatory Shear Index (OSI): Quantifies directional changes and fluctuations in WSS
Results
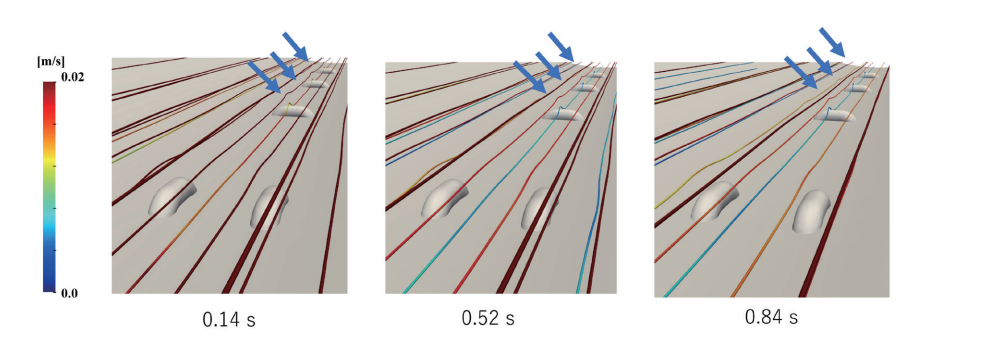
1. Streamlines (SL)
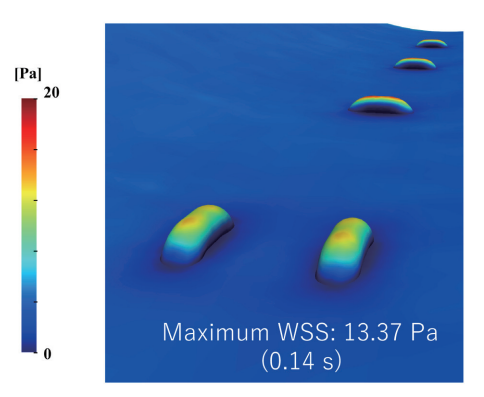
Overall, blood flow remained nearly linear, and no significant flow disturbance was observed across the anastomotic site. However, localized streamline disturbances were observed near the three sutures arranged in series on the outflow side.
2. Wall Shear Stress (WSS)
A peak WSS value of 13.37 Pa was observed at the tip of the intraluminally protruding suture at approximately 0.14 s, when blood flow velocity was maximal. This localized increase in WSS occurred due to concentration of shear stress where the flow encountered the suture as an obstacle.
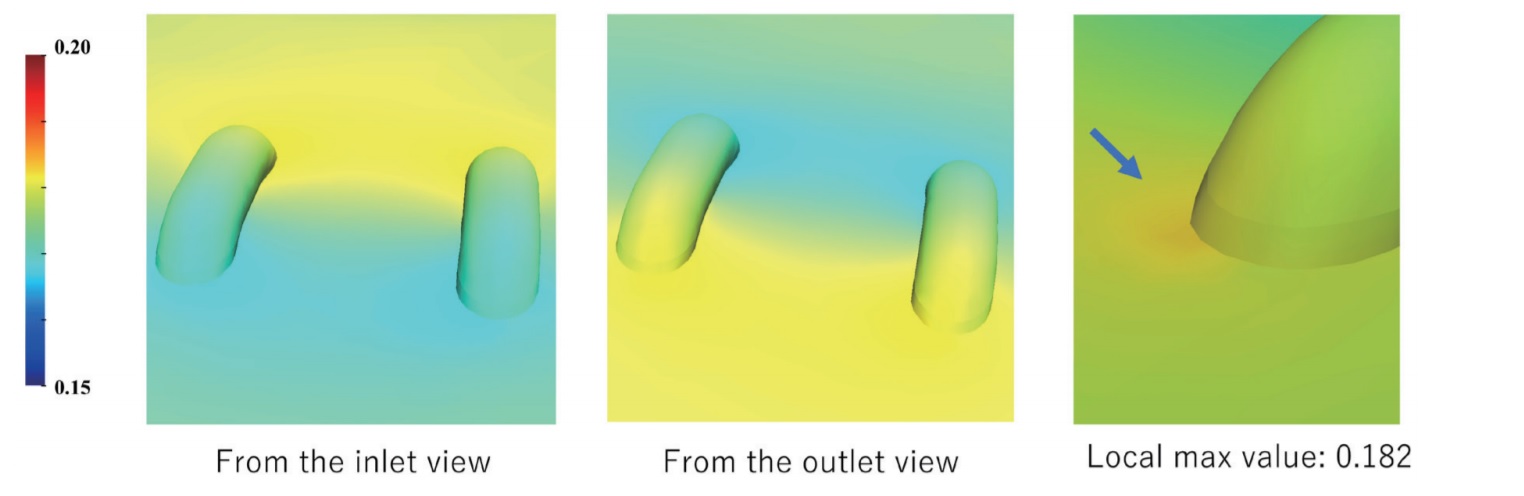
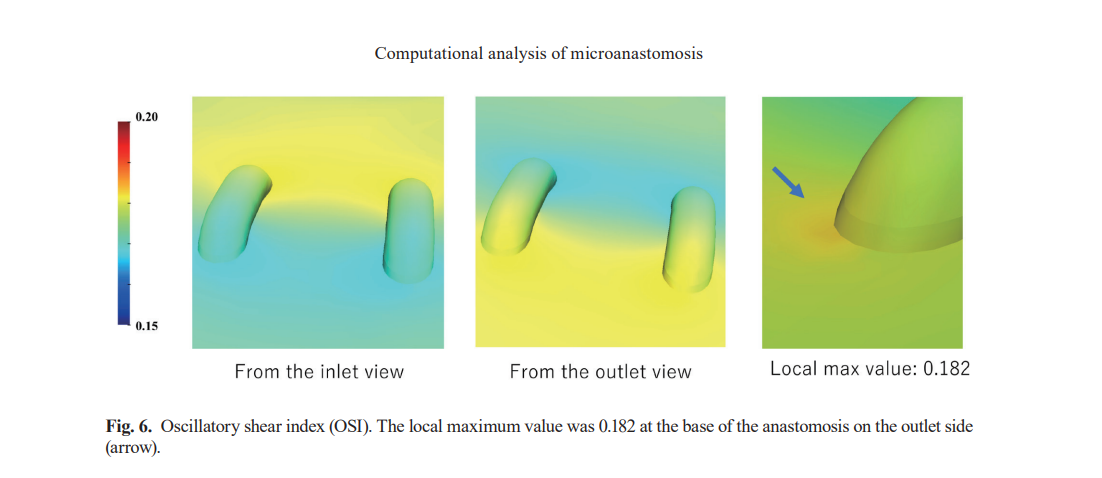
3. Oscillatory Shear Index (OSI)
A local maximum OSI value of 0.182 was detected at the base of the sutures on the outflow side. A high OSI indicates significant directional fluctuation of WSS during a single cardiac cycle, suggesting unstable flow conditions. This finding implies that flow reversal and vortex formation may occur at the suture base, potentially increasing the risk of thrombus formation.
Discussion
High WSS is known to suppress thrombus formation, and the sufficiently elevated WSS observed at the suture tips suggests a low thrombotic risk at these locations. In contrast, the high OSI observed at the suture base is associated with increased oxidative stress and endothelial damage, both of which are linked to elevated thrombotic risk. Therefore, the suture base may serve as a potential initiation site for thrombosis.
These findings indicate that, in microvascular anastomosis, minimizing excessive suture exposure to the vessel lumen, avoiding over-tightening, and ensuring secure knot fixation are important to reduce flow disturbance and mitigate thrombotic risk.
However, CFD analysis has inherent limitations, including assumptions in model construction, the non-Newtonian nature of blood, and the elastic properties of vessel walls. Future studies should incorporate clinical data to improve model accuracy and enhance clinical relevance.
Reference
Yagi, S., Sasaki, T., Fukuhara, T., Fujii, K., Morita, M., Suyama, Y., Fukuoka, K., Nishino, T., & Hisatome, I. (2020). Hemodynamic Analysis of a Microanastomosis Using Computational Fluid Dynamics. Yonago Acta Medica, 63(4), 308–312.
Hemodynamic predictors of negative false lumen remodeling after Frozen Elephant Trunk for acute aortic dissection
Overview
After Frozen Elephant Trunk (FET) surgery for acute aortic dissection, negative remodeling of the false lumen (FL) in the descending aorta—defined as failure of FL shrinkage and progressive enlargement—represents an important clinical issue, as it increases the risk of reoperation or additional interventions.
Although morphological assessment using computed tomography (CT) has traditionally been the main approach, the role of functional blood flow characteristics in false lumen remodeling has not been fully elucidated.
In this study, 4D flow MRI was used to analyze postoperative false lumen hemodynamics after FET surgery, with the aim of identifying hemodynamic indicators that can predict false lumen expansion.
PDF
Although morphological assessment using computed tomography (CT) has traditionally been the main approach, the role of functional blood flow characteristics in false lumen remodeling has not been fully elucidated.
In this study, 4D flow MRI was used to analyze postoperative false lumen hemodynamics after FET surgery, with the aim of identifying hemodynamic indicators that can predict false lumen expansion.
Study population and Design
Study population
- Patients who underwent FET surgery for acute aortic dissectionCases with a patent or partially thrombosed false lumen after surgery
Study Design
- Single-center, restrospective observational study- 4D Flow MRI performed within 3 months after surgery
Definition of negative false lumen remodeling
Negative false lumen remodeling was defined as a ≥10% increase in false lumen volume on follow-up CT imaging.Hemodynamic analysis (4D Flow MRI)
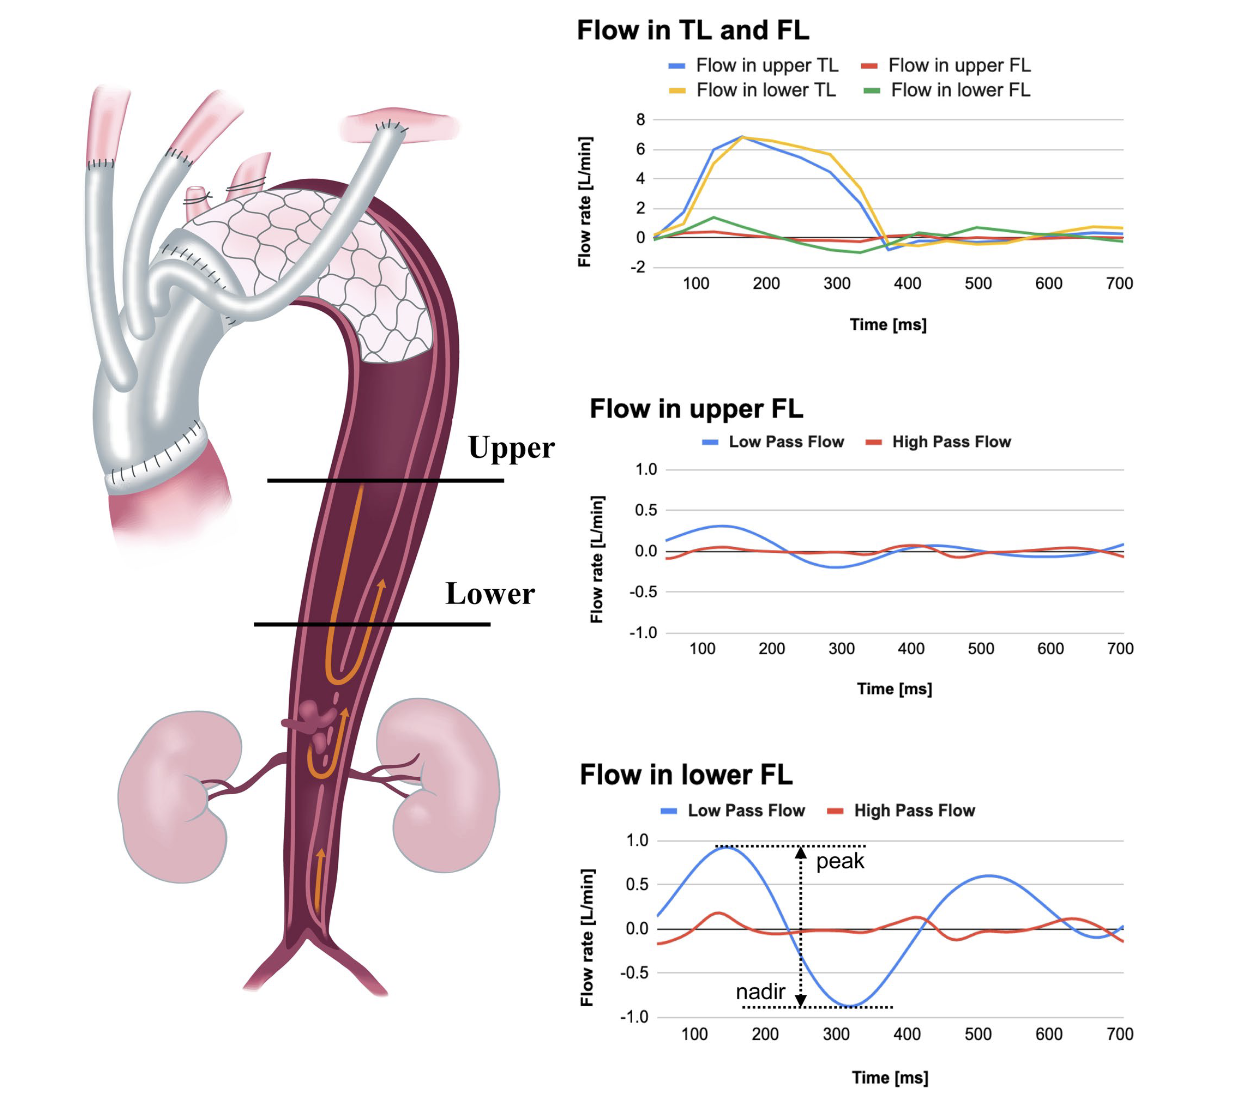
- False lumen blood flow in the descending aorta distal to the FETwas evaluated.- Hemodynamkc analysis was performed throughout the entire cardiac cycle, assessing antegrade and retrograde flow components withing the false lumen.
- In particular, the difference between the maximum and minimum false lumen flow rates within a single cardiac cycle was calculated as an index, reflecting flow fluctuatioin and bidirectional flow within the false lumen.
Results
Of the 33 patients included in the final analysis, negative false lumen remodeling was observed in 6 cases.
In contrast, patients without negative remodeling demonstrated a reduction in false lumen volume, while true lumen volume increased or remained stable.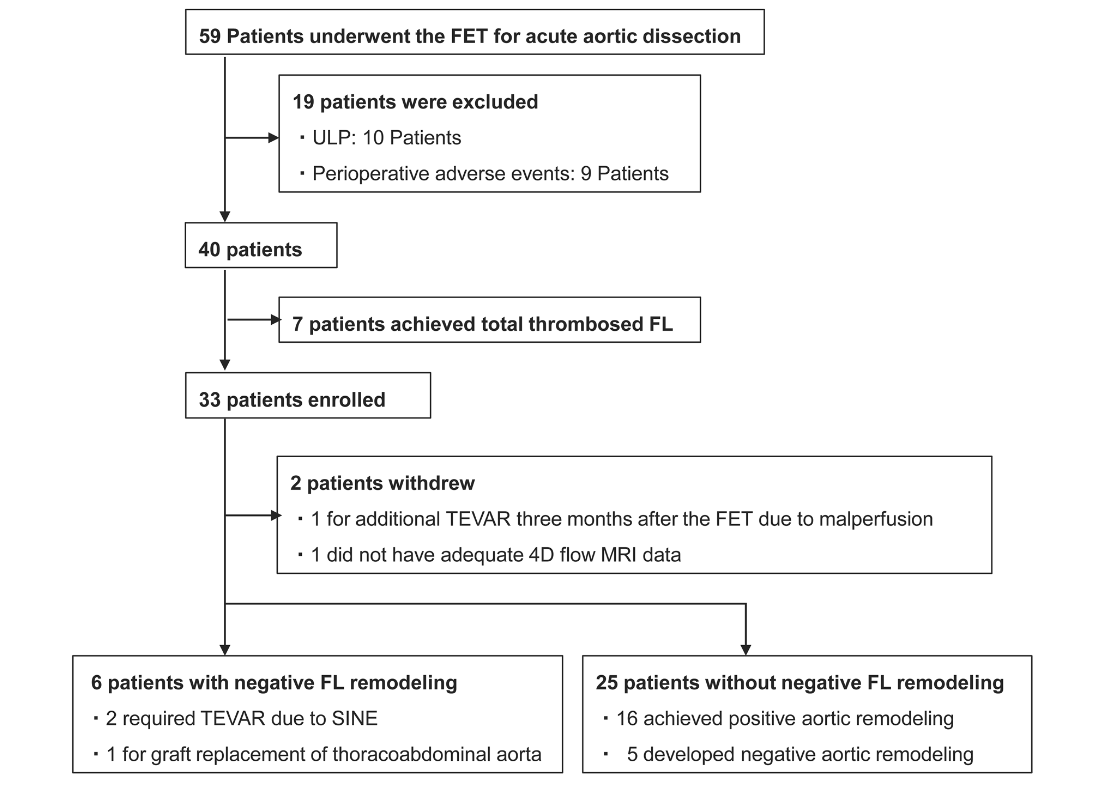
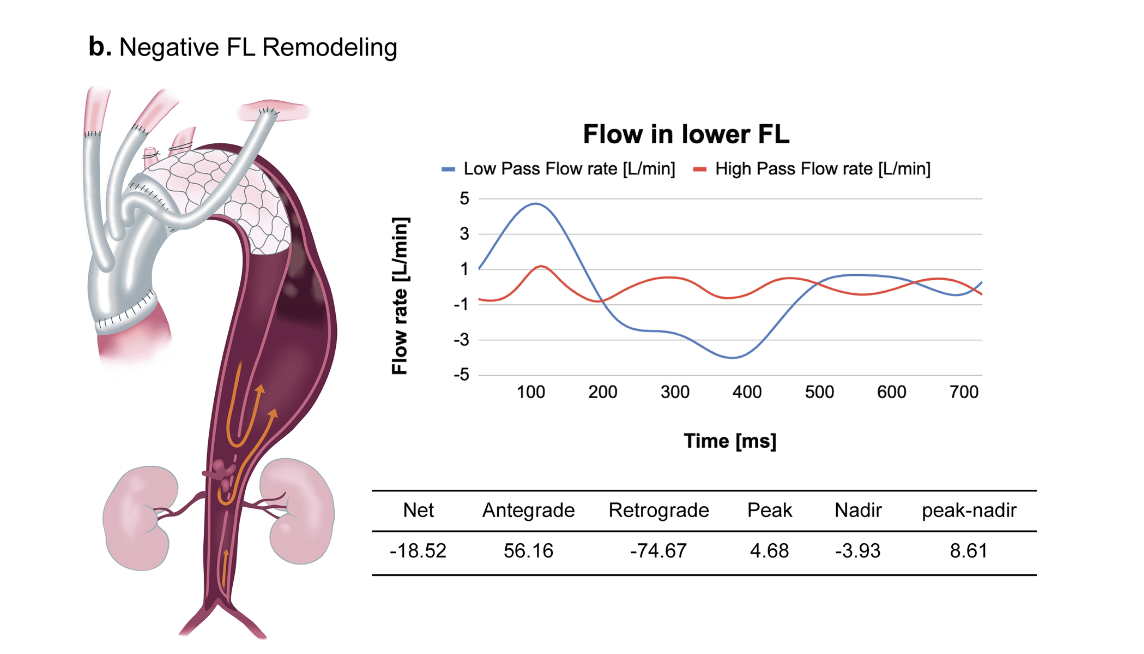
Specifically, antegrade flow appeared first, followed by the emergence of a retrograde flow component.
This biphasic flow pattern suggests instability of blood flow within the false lumen.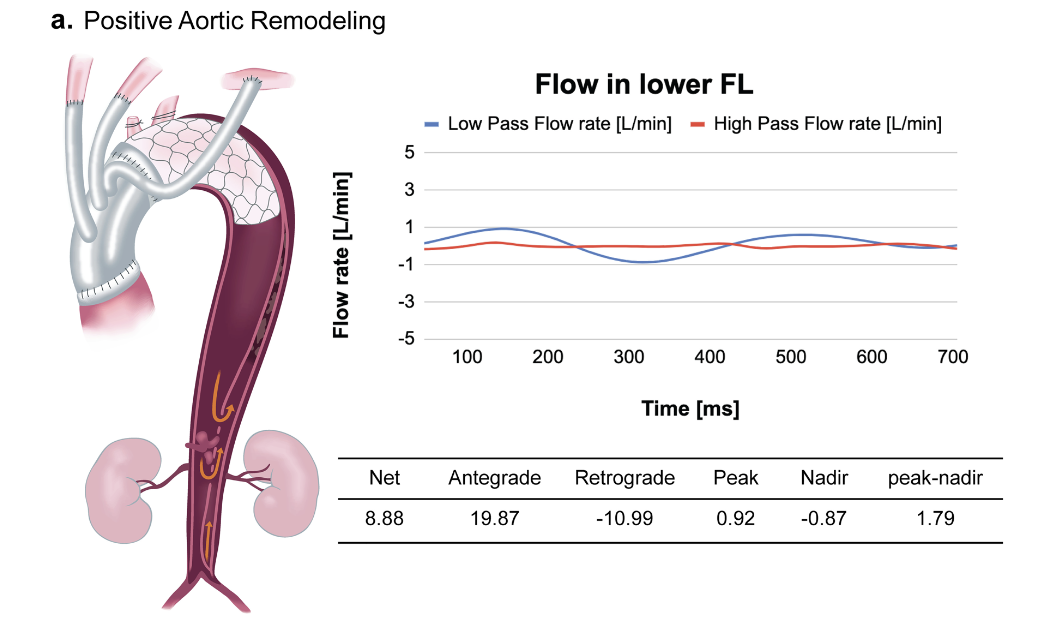
The peak-nadir-range - defined as the difference between the maximum and minimum flow rates within a single cardiac cyclle - showed a positive correlation with the false lumen volume expansion rate, indicating that greater flow fluctuation within the false lumen was associated with a higher likelihood of false lumen enlargement.
In contrast, patients without negative remodeling demonstrated a reduction in false lumen volume, while true lumen volume increased or remained stable.
False lumen flow patterns
In many cases, false lumen flow exhibited a biphasic pattern during systole.Specifically, antegrade flow appeared first, followed by the emergence of a retrograde flow component.
This biphasic flow pattern suggests instability of blood flow within the false lumen.
Association between hemodynamic indicators and remodeling
Patients with negative false lumen remodeling showed a significantly larger peak-nadir range of false lumen flow rate.The peak-nadir-range - defined as the difference between the maximum and minimum flow rates within a single cardiac cyclle - showed a positive correlation with the false lumen volume expansion rate, indicating that greater flow fluctuation within the false lumen was associated with a higher likelihood of false lumen enlargement.
Discussion
Persistent bidirectional flow with large fluctuation within the false lumen after FET surgery may inhibit thrombus formation, promote false lumen patency and expansion, and ultimately contribute to negative remodeling.
The peak-nadir range allows simplw quantification of flow direction changes and amplitede and may serve as a functional risk indicator that cannot be captured by morphological CT evaluation alone.
Hemodynamic assessment using 4D flow MRI does not require radiation exposure or contrast agents and may be useful in the future for identifying high-risk patients who may require additional interventions such as thoracic endovascular aortic repair (TEVAR).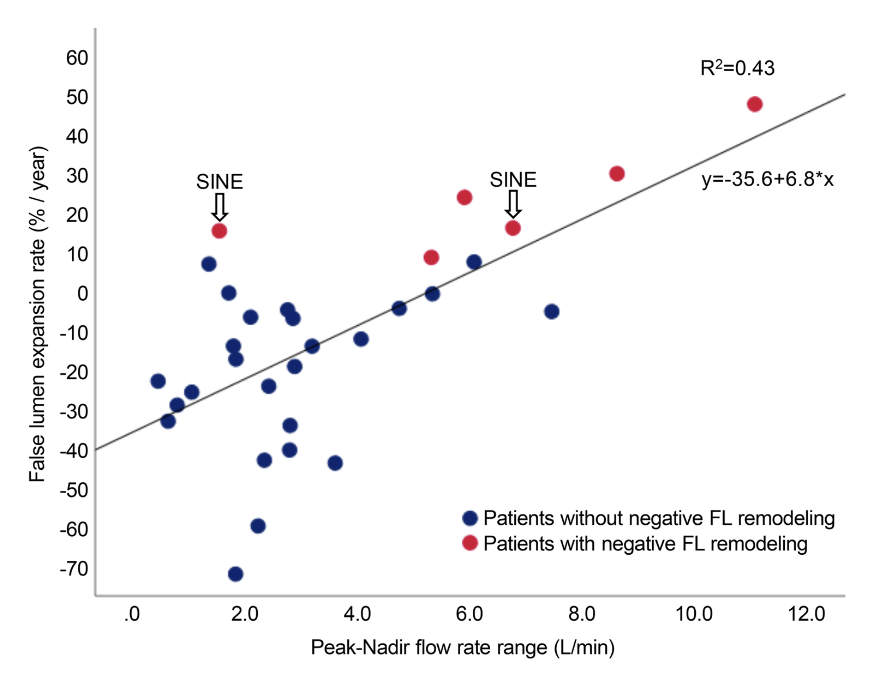
Conclusion
False lumen flow after FET surgery frequently exhibits a biphasic pattern during systole. The peak-nadier range of false lumen flow rate may serve as a hemodynamic indicator for predicting false lumen expansion and negative false lumen remodeling.
Reference
Takei, Y., Miyazaki, S., Suzuki, K., Saito, S., Oogaki, H., Muraoka, Y., Ogasawara, T., Tezuka, M., Shibasaki, I., & Fukuda, H. (2024). Hemodynamic predictors of negative false lumen remodeling after frozen elephant trunk for acute aortic dissection. General Thoracic and Cardiovascular Surgery, 72(6), 376–386.
Computational fluid dynamics to simulate stenotic lesions in coronary end-to-side anastomosis
Objectives
End-to-side anastomosis is common in coronary artery bypass grafting, although restrictive suturing can narrow the anastomosis. We evaluated ex vivo end-to-side models by numerically simulating fluid dynamics to compare various degrees of stenotic anastomoses to predict haemodynamic effects.
PDF
Methods
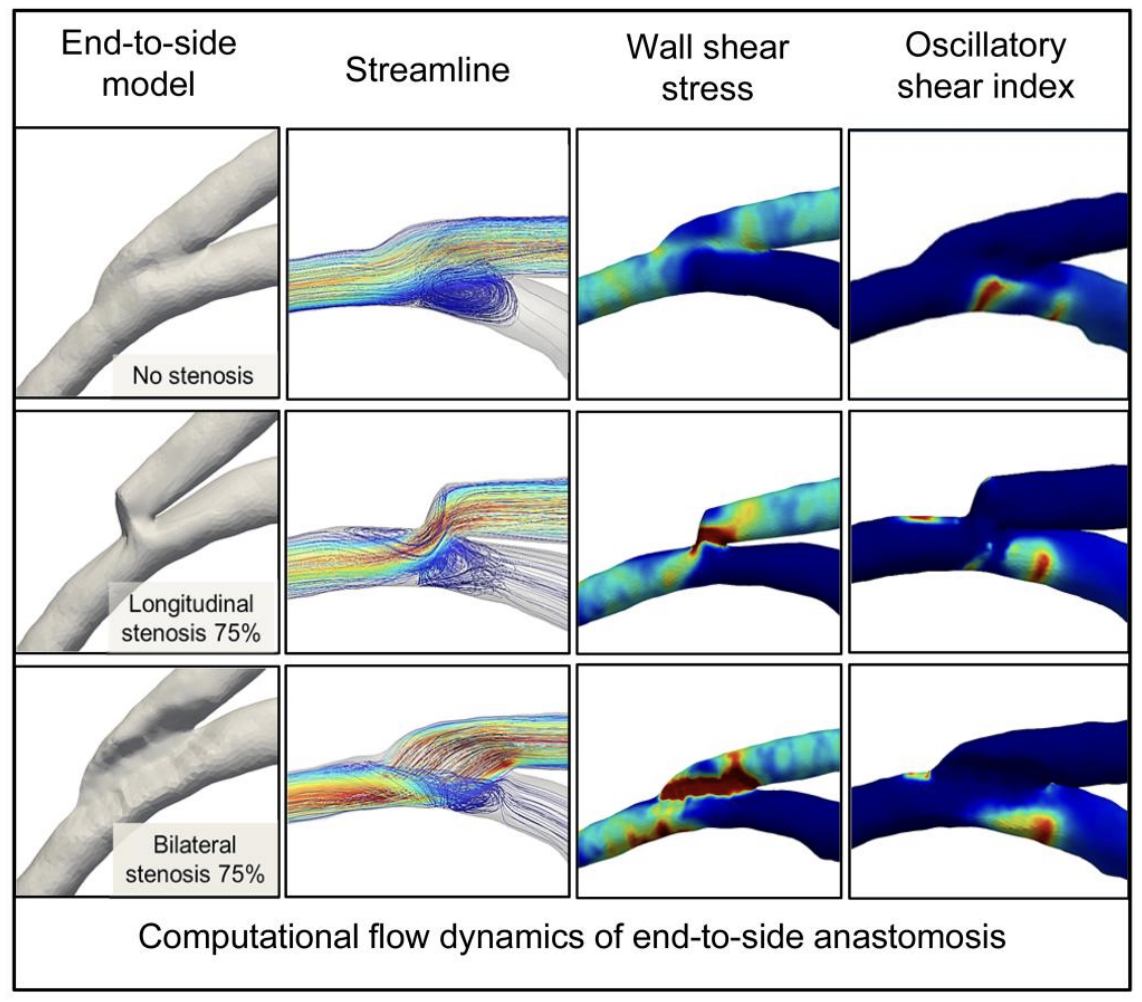
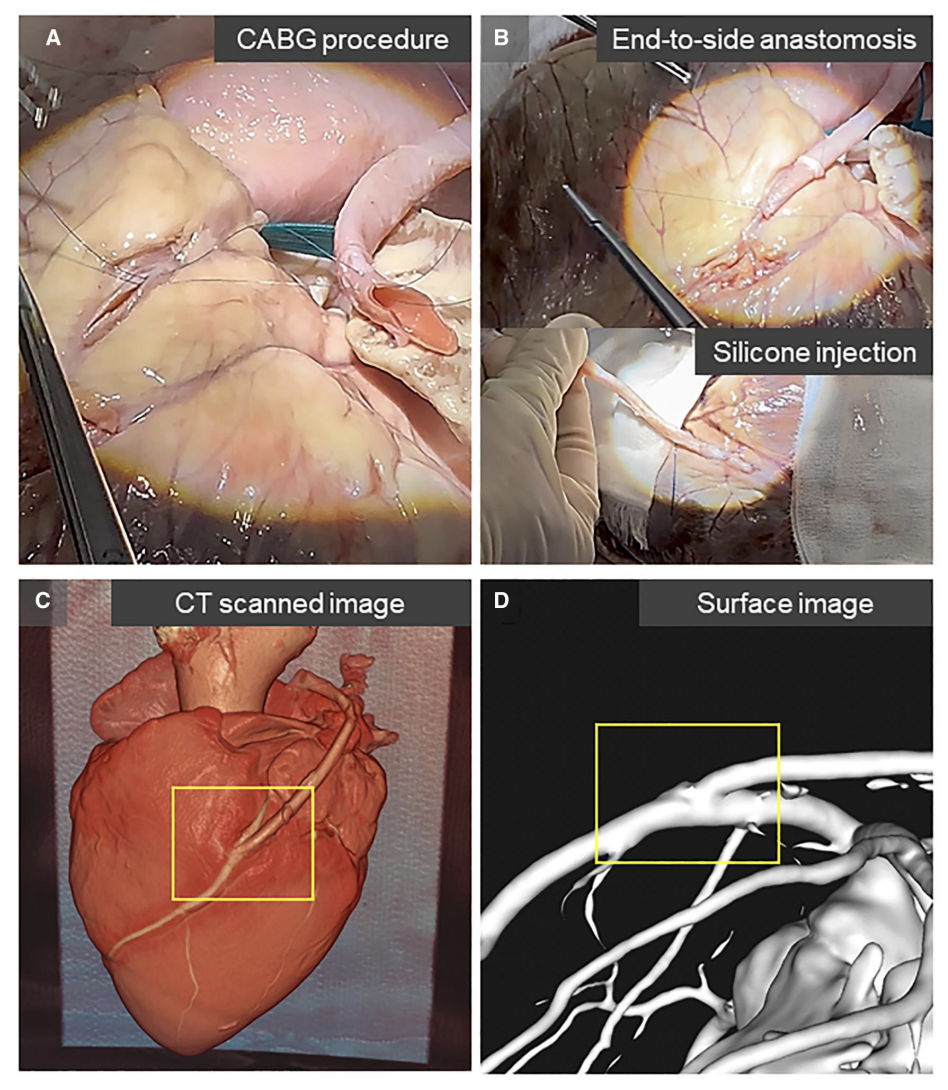
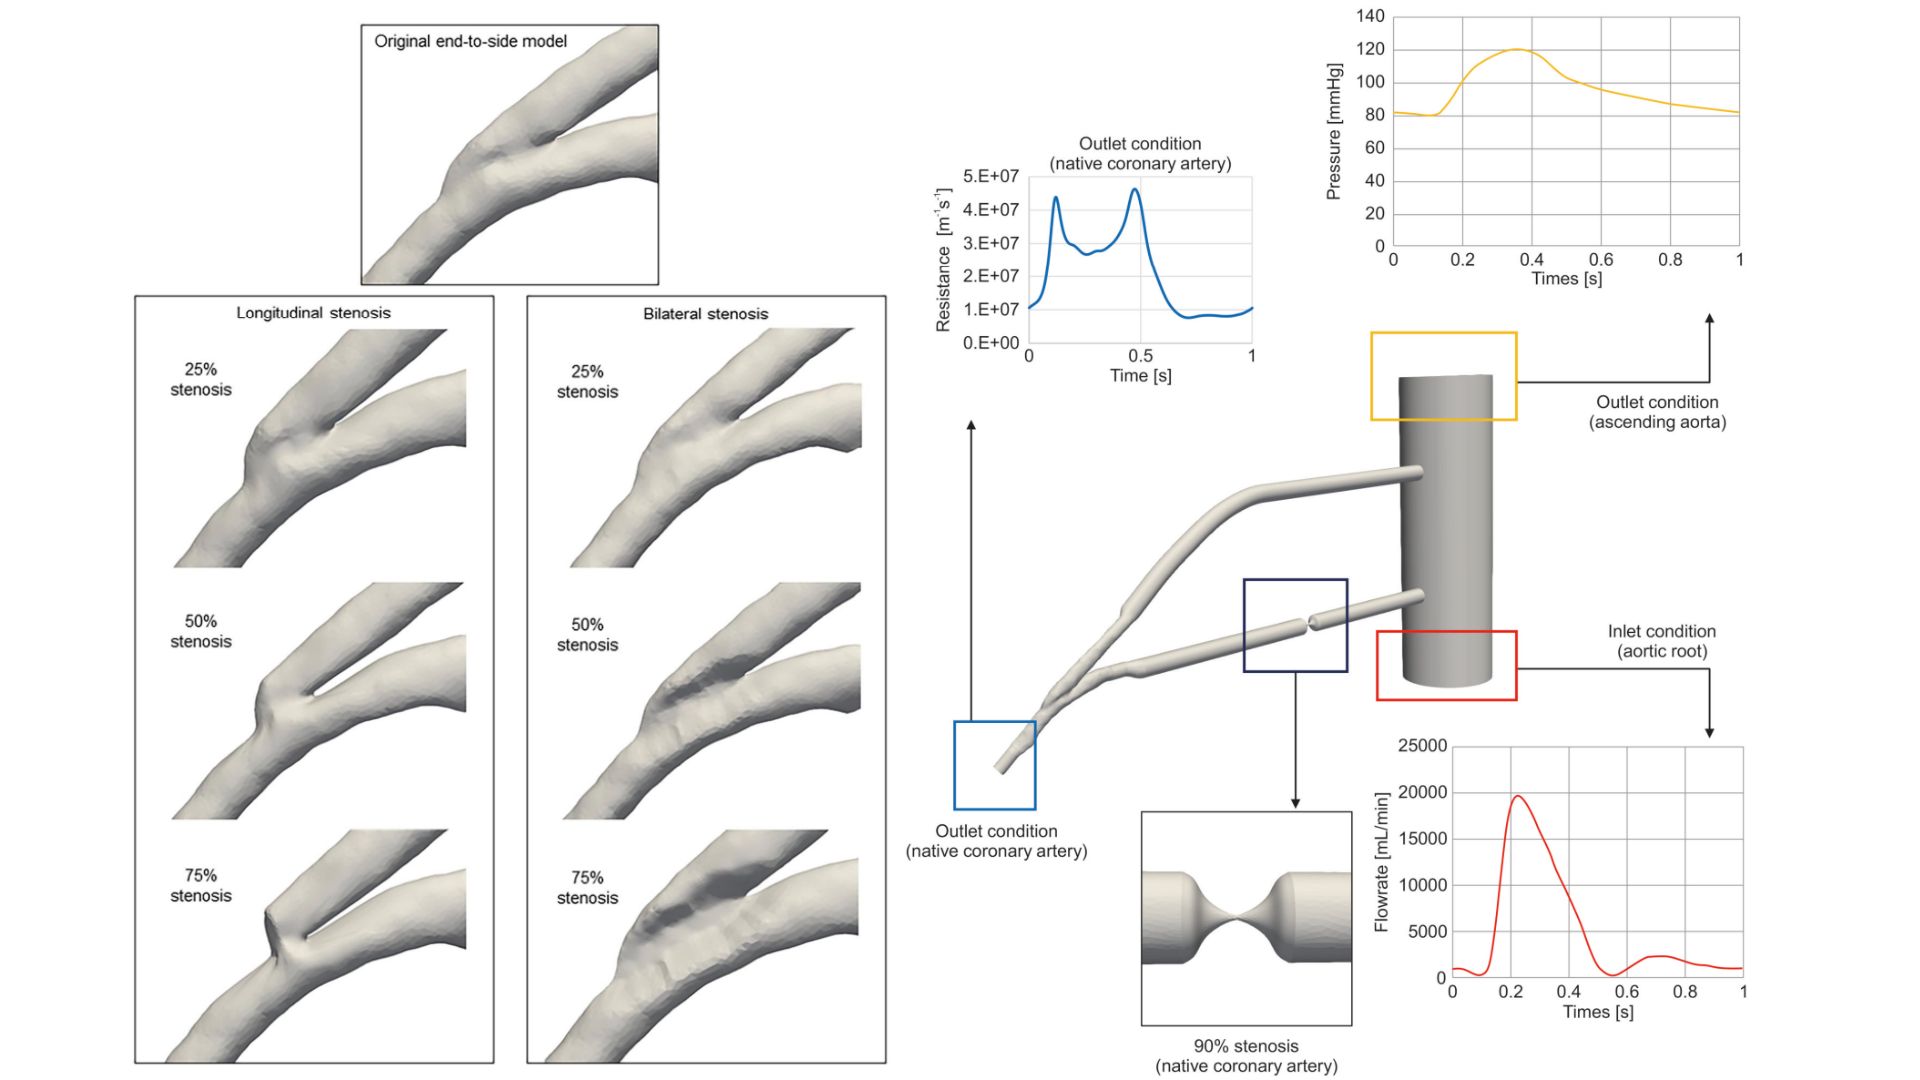
A carotid artery was grafted via an end-to-side anastomosis onto the left anterior descending artery of a porcine heart, with liquid silicone injected into the vessels. The end-to-side image was acquired via multidetector computed tomography for reference, and models of longitudinal shortening and bilateral narrowing were created with 25%, 50%, 75%, along with 90%, and 100% stenosis in the native coronary artery. Haemodynamics were analysed using computational fluid dynamics simulations to calculate streamlines, wall shear stress and oscillatory shear index.
Results
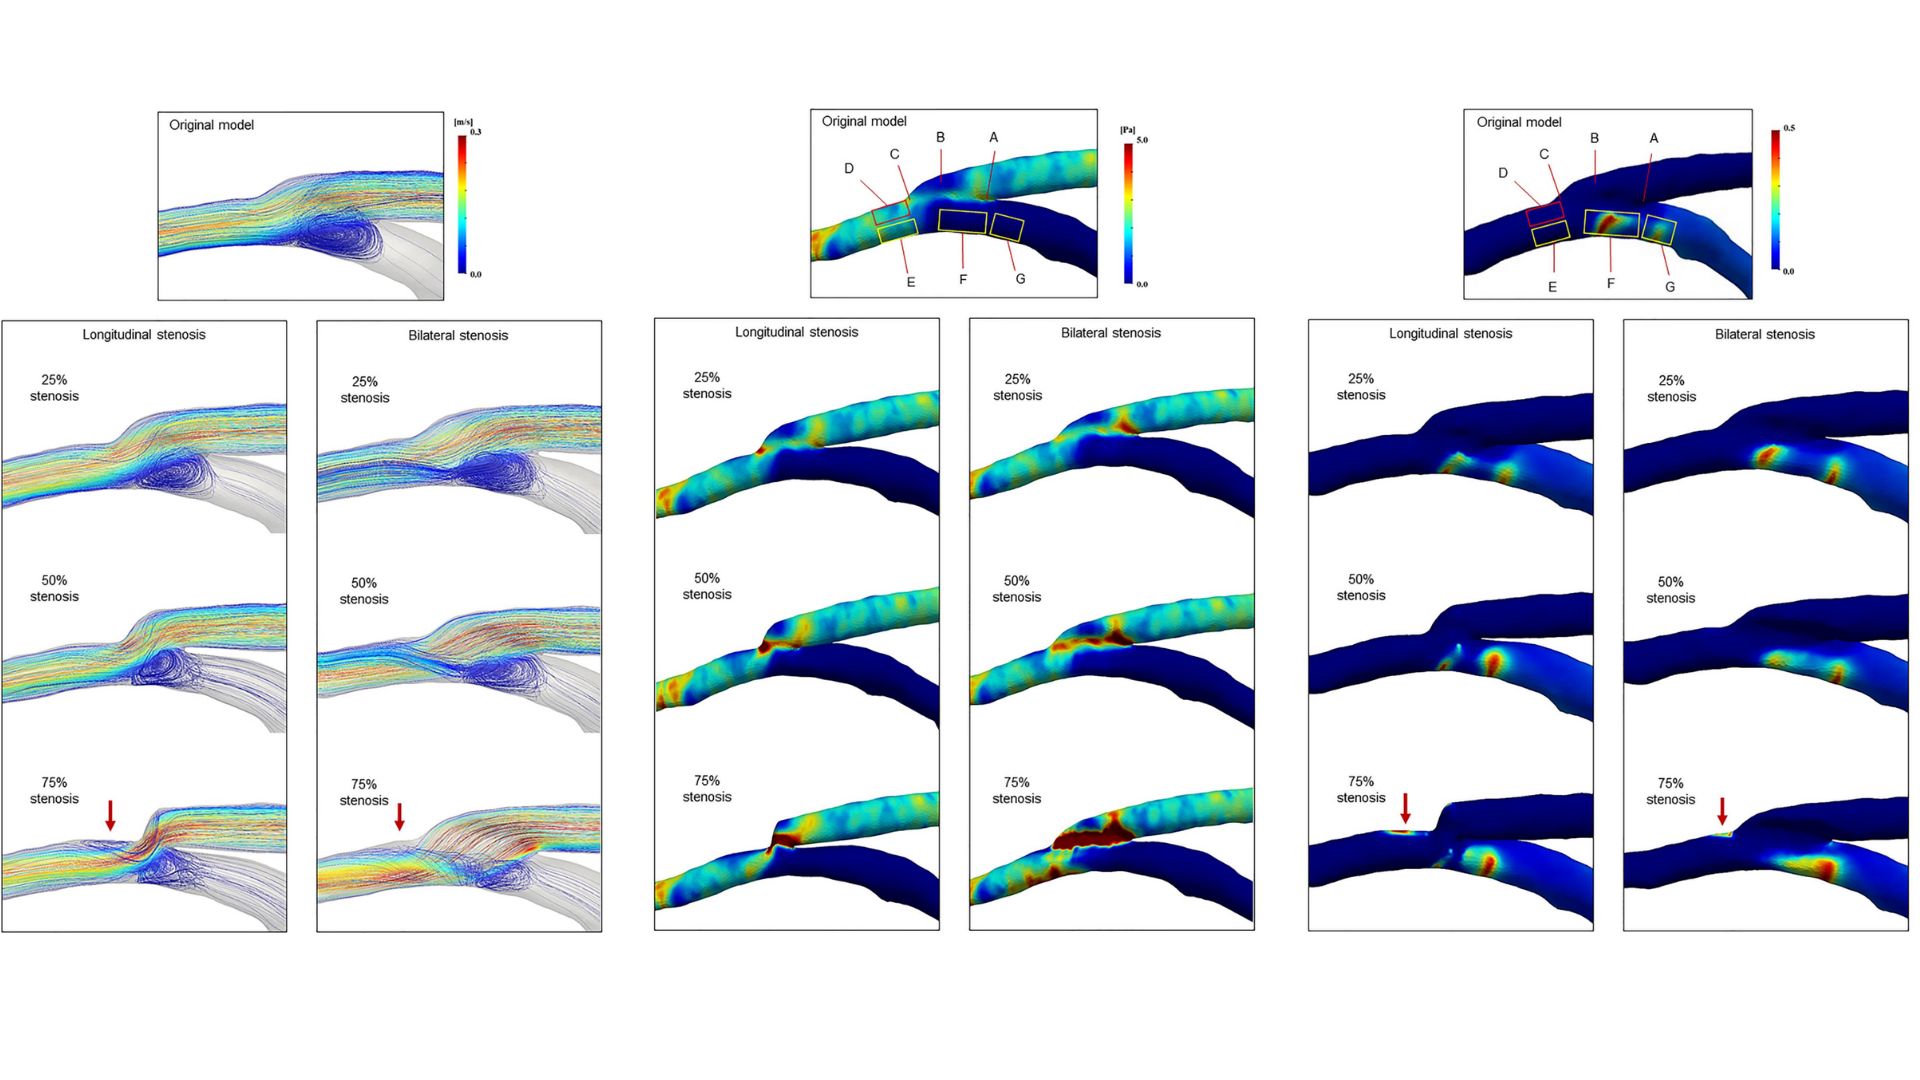
In the reference model, the graft inflow impinged on the floor of the native artery, creating a recirculating vortex and a high oscillatory shear index region near the heel. As the graft flow angle increased with longitudinal stenosis, bilateral stenosis generated helical flow near the lateral wall of the native artery, worsening with increased stenosis. At 75% stenosis, both longitudinal shortening and bilateral narrowing caused abnormal flow separation, with low wall shear stress and high oscillatory regions forming distal to the toe of the anastomosis.
Conclusions
Computational fluid dynamics modelling predicts that end-to-side anastomoses with 75% longitudinal or bilateral stenosis are at a risk of intimal hyperplasia causing graft failure, while anastomotic stenosis <50% indicates acceptable haemodynamics. Future studies should explore long-term clinical outcomes with suboptimal surgical anastomotic construction.
Reference
Kamiya, K., Terada, S., Nagatani, Y., Matsubayashi, Y., Suzuki, K., Miyazaki, S., Matsui, H., Takano, S., Nakata, S., Watanabe, Y., & Suzuki, T. (2025). Computational fluid dynamics to simulate stenotic lesions in coronary end-to-side anastomosis. Interdisciplinary CardioVascular and Thoracic Surgery, 40(2), ivaf013.
Computed Fluid Dynamics Analysis for SVC-to-RPA Anastomosis With Antegrade Pulmonary Flow
Abstract
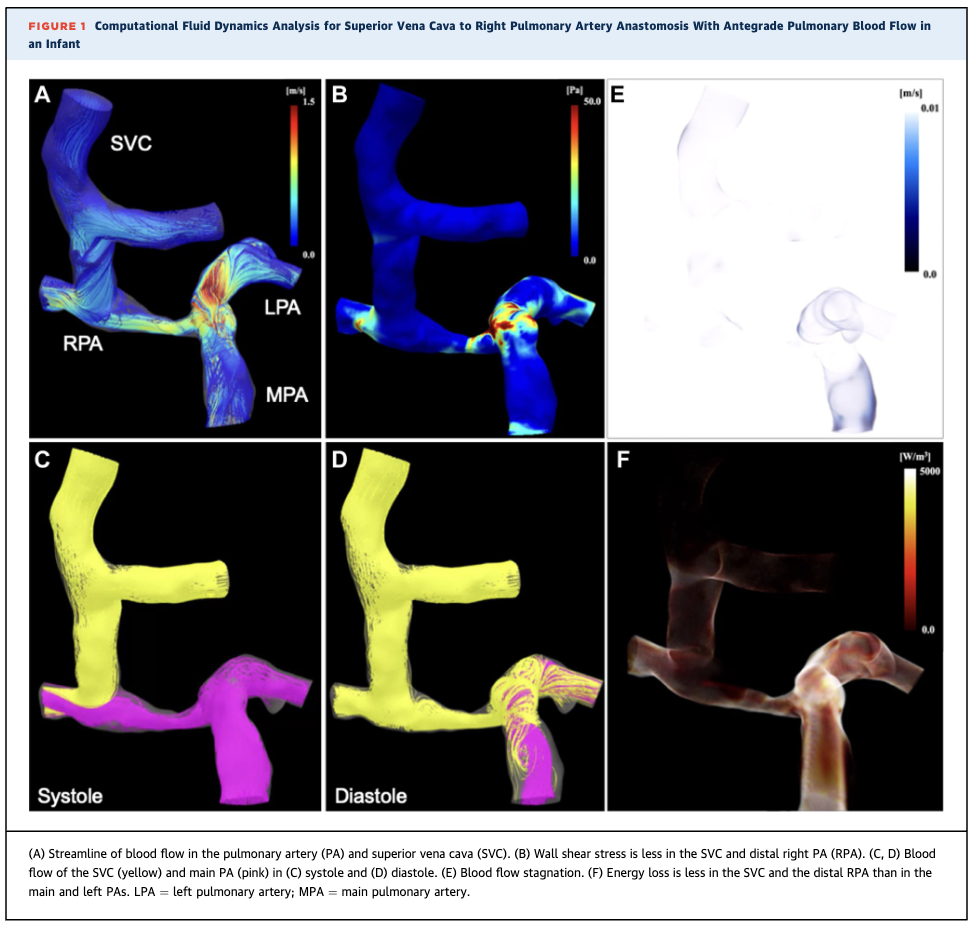
This report describes an infant who underwent superior vena cava–to–right pulmonary artery (SVC-to-RPA) anastomosis with restricted antegrade pulmonary artery flow. Computational fluid dynamics (CFD) analysis demonstrated that residual right pulmonary artery stenosis reduced shear stress and energy loss in the SVC, suggesting favorable hemodynamics and a potential reduction in postoperative complications.
PDF/Videos
Clinical Vignette
A 1-year-old boy with ventricular septal defect, atrial septal defect, hypoplastic tricuspid valve, and a small right ventricle (approximately 50% of normal size) underwent SVC-to-RPA anastomosis, closure of septal defects, and pulmonary artery de-banding. Proximal RPA stenosis caused by previous PA banding was intentionally preserved to avoid competition between SVC flow and antegrade pulmonary artery flow.
Methods
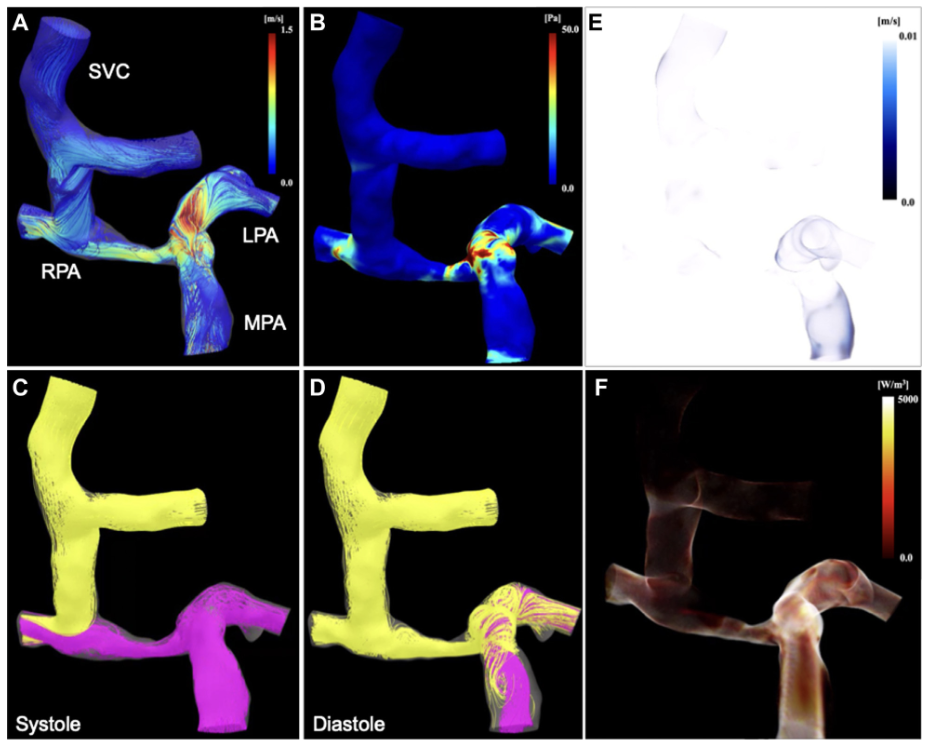
Ten months after surgery, patient-specific CFD analysis based on imaging data was performed to evaluate detailed hemodynamics, including flow streamlines, wall shear stress, flow stagnation, and energy loss in the pulmonary arteries and SVC.
Results
CFD analysis revealed turbulent flow with relatively high wall shear stress in the main pulmonary artery, left pulmonary artery, and proximal RPA, whereas smooth laminar flow with low shear stress, minimal stagnation, and low energy loss was observed in the SVC and distal RPA. Blood flow from the SVC and main pulmonary artery was distributed to both lungs without competitive flow, supporting balanced pulmonary perfusion.
Reference
Sumitomo, N. F., Kodo, K., Oyanagi, T., Kimura, N., & Yamagishi, H. (2024). Computed Fluid Dynamics Analysis for SVC-to-RPA Anastomosis With Antegrade Pulmonary Flow. JACC: Case Reports, 29(8), Article 102263.
Hemolytic anemia caused by an excessively kinked prosthetic graft after total arch replacement detected by 4-dimensional flow magnetic resonance imaging: A case report
Abstract
Hemolytic anemia after aortic surgery is a rare complication and may be caused by abnormal blood flow resulting from an excessively kinked prosthetic graft.
While computed tomography can identify morphological abnormalities, it is difficult to determine which lesion functionally contributes to hemolysis.
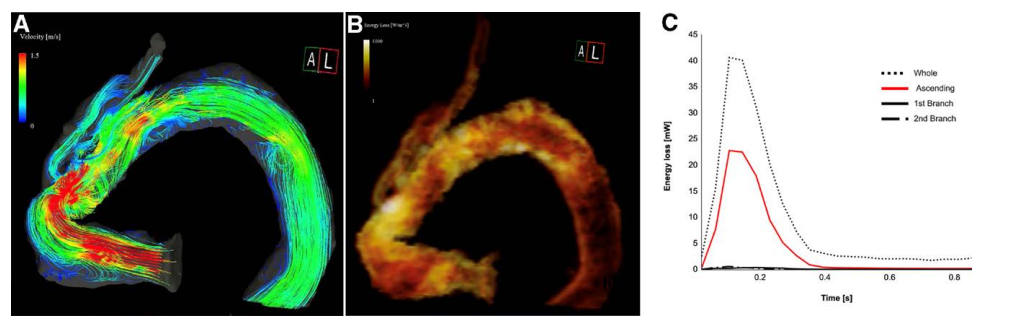
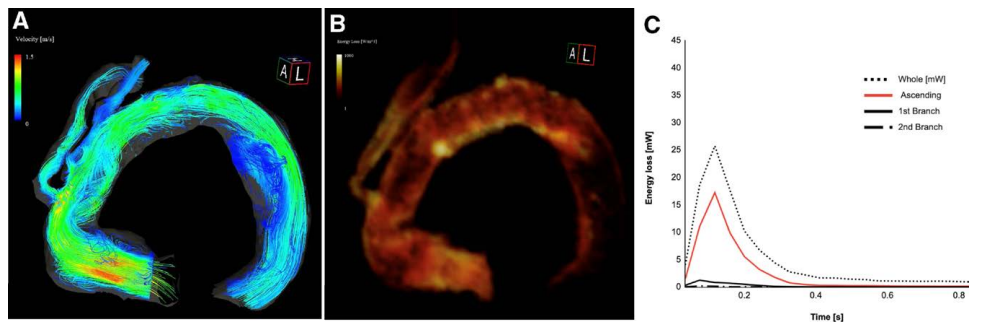
This case report describes a patient in whom 4D flow MRI was used to evaluate abnormal flow and viscous energy loss (VEL), allowing identification of the causative lesion and guidance toward a less invasive revision strategy.
PDF
This case report describes a patient in whom 4D flow MRI was used to evaluate abnormal flow and viscous energy loss (VEL), allowing identification of the causative lesion and guidance toward a less invasive revision strategy.
Clinical Vignette
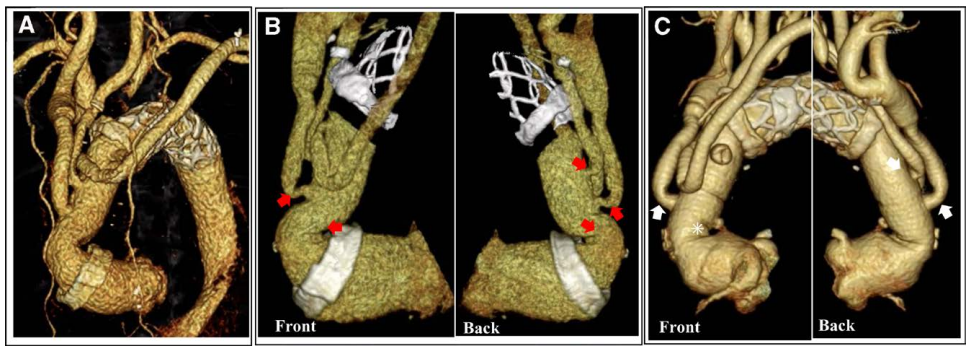
A 70-year-old woman who had undergone total arch replacement with a frozen elephant trunk (FET) for acute Stanford type A aortic dissection five years earlier.
She presented with dizziness and fatigue and was diagnosed with hemolytic anemia based on laboratory findings.
She presented with dizziness and fatigue and was diagnosed with hemolytic anemia based on laboratory findings.
Imaging and Hemodynamic Assessment
Computed Tomography Findings
Multiple kinked lesions were observed in the ascending aortic graft and cervical branches on enhanced computed tomography; however, the causative lesion for hemolysis could not be identified based on morphological findings alone.
Four-Dimensional Flow MRI Analysis
Non-contrast four-dimensional flow MRI was used to assess aortic blood flow. Highly accelerated vortical flow and markedly elevated viscous energy loss (VEL) were observed at the kinked portion of the ascending graft, whereas VEL values at the cervical branches were low.
Results
CFD analysis revealed turbulent flow with relatively high wall shear stress in the main pulmonary artery, left pulmonary artery, and proximal RPA, whereas smooth laminar flow with low shear stress, minimal stagnation, and low energy loss was observed in the SVC and distal RPA. Blood flow from the SVC and main pulmonary artery was distributed to both lungs without competitive flow, supporting balanced pulmonary perfusion.
Reference
Takei, Y., Shibasaki, I., Suzuki, K., Miyazaki, S., Hirota, S., Ohashi, H., Saito, S., & Fukuda, H. (2022). Hemolytic anemia caused by an excessively kinked prosthetic graft after total arch replacement detected by 4-dimensional flow magnetic resonance imaging: A case report. Medicine, 101(29), e29617.
Development of Cardiac Computed Tomography for Evaluation of Aortic Valve Stenosis
Abstract
Aortic valve stenosis (AS) is a severe valvular disease imposing a high afterload on the left ventricle, with an increasing prevalence due to population aging. With the widespread adoption of TAVI, the importance of detailed pre- and post-procedural evaluation has increased.
This review summarizes recent advances in cardiac computed tomography (CT)—including detector technology, faster gantry rotation, advanced reconstruction, and dual-energy imaging—and discusses their role in the evaluation of AS
PDF
This review summarizes recent advances in cardiac computed tomography (CT)—including detector technology, faster gantry rotation, advanced reconstruction, and dual-energy imaging—and discusses their role in the evaluation of AS
Clinical Vignette
AS can lead to syncope, angina, heart failure, and sudden death if untreated. While SAVR has been the standard therapy, TAVI has expanded treatment options for elderly and high-risk patients. In younger patients, careful valve selection is required due to concerns regarding long-term durability.
Imaging and Hemodynamic Assessment
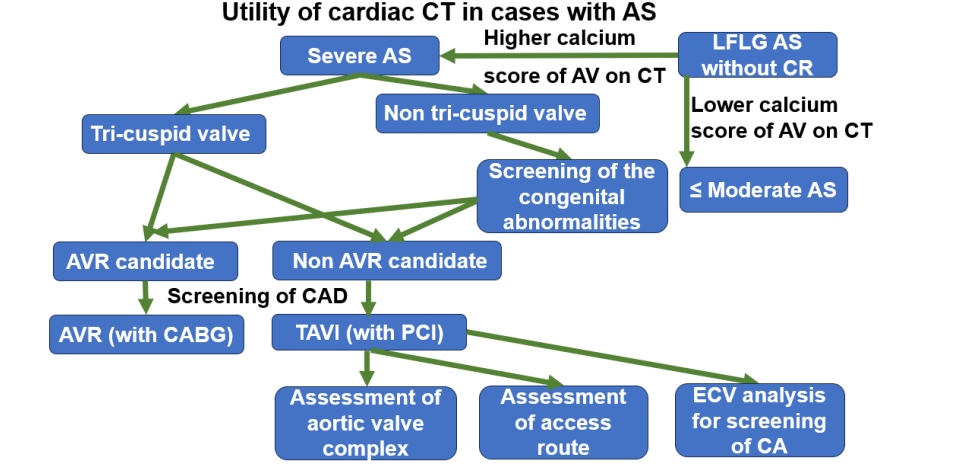
Utility of Cardiac CT in AS
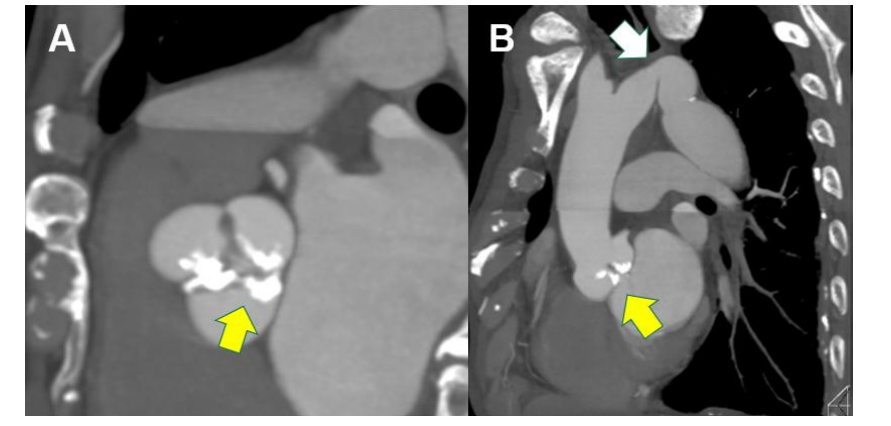
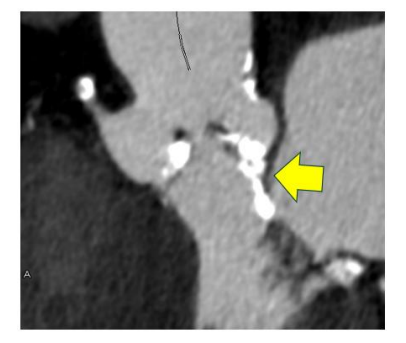
Cardiac CT enables comprehensive evaluation beyond the coronary arteries, including aortic valve morphology, calcification, annular size, and ventricular function. Non-contrast CT calcium scoring is particularly useful when echocardiographic severity assessment is inconclusive.
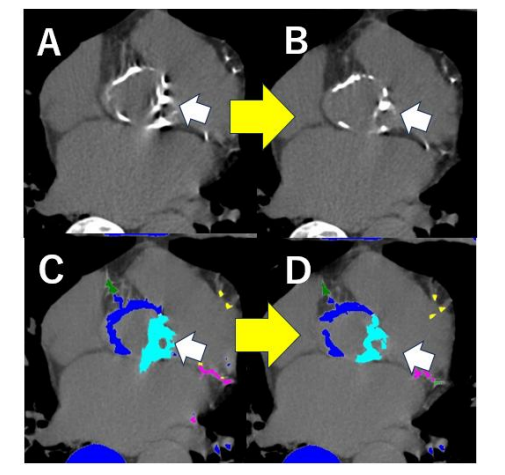
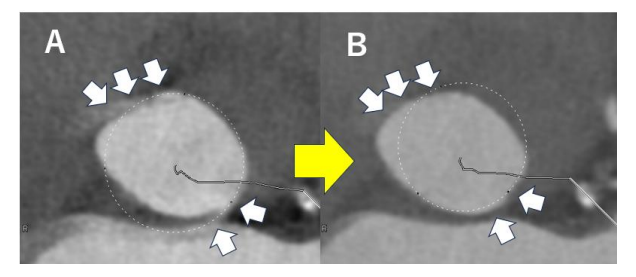
Motion Correction and Valve Calcification Assessment
Because the aortic valve is a rapidly moving structure, motion artifacts have limited CT accuracy. Second-generation motion correction algorithms significantly improve the accuracy of valve calcium scoring and annular measurements.
Evaluation of Congenital Abnormalities and Bicuspid Valves
In younger patients, AS is often caused by bicuspid aortic valves. CT allows detailed assessment of leaflet morphology, Sievers classification, and associated aortic abnormalities such as dilation or coarctation.
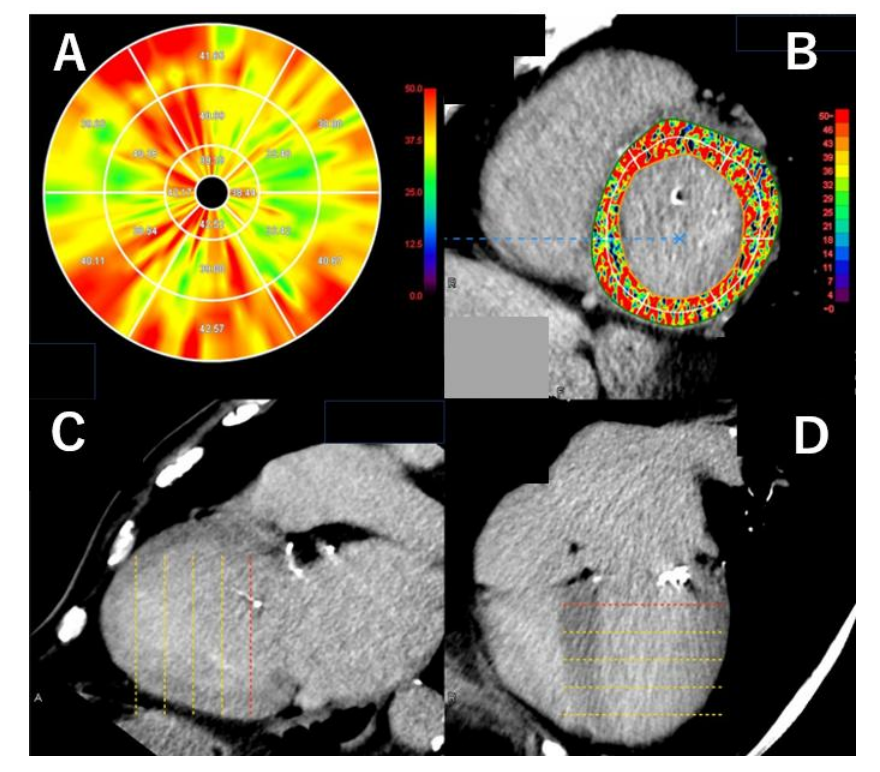
Assessment of Myocardial Damage and ECV
Recent advances allow delayed enhancement CT and left ventricular extracellular volume (ECV) quantification, enabling assessment of myocardial fibrosis. Elevated preoperative ECV has been associated with worse outcomes after TAVI.
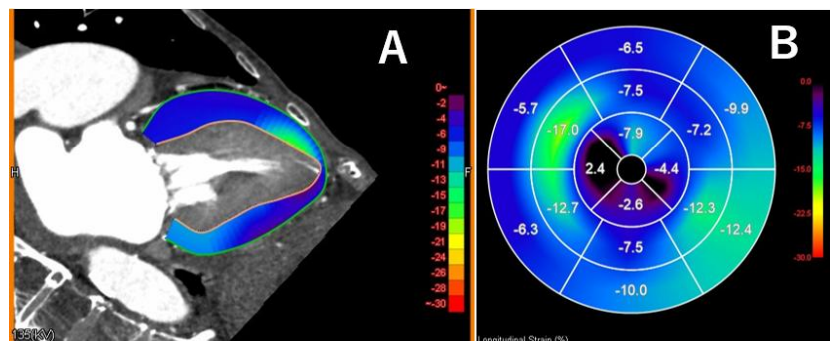
Functional and Strain Analysis Using CT
With whole-cycle acquisition and advanced software, CT can now assess ventricular function and global longitudinal strain (GLS), which may provide prognostic information.
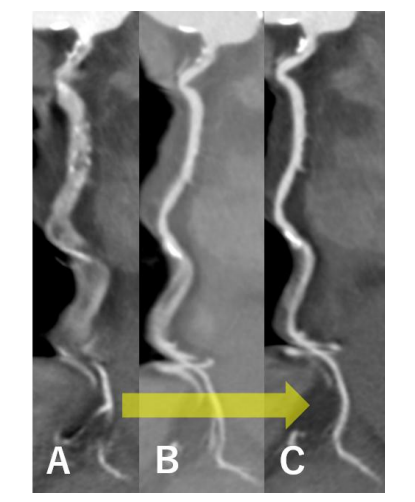
Pre- and Post-TAVI Assessment and CT-Based Flow Analysis
CT plays a crucial role in pre-TAVI planning, including valve sizing, access route assessment, and coronary obstruction risk evaluation. CT-based CFD analysis has also emerged as a tool to assess post-TAVI prosthetic valve thrombosis risk.
Results
Cardiac CT has evolved into a comprehensive modality covering morphological, functional, and hemodynamic assessment. With continued reductions in radiation exposure, its clinical value in the management of aortic stenosis is expected to further increase.
Conclusion
Cardiac CT plays a central role in the management of AS across age groups and treatment strategies, and clinicians must fully understand and appropriately utilize its technological advancements.
Reference
Takaoka, H., Sasaki, H., Ota, J., Noguchi, Y., Matsumoto, M., Yoshida, K., Suzuki, K., Aoki, S., Yashima, S., & Kinoshita, M. (2025). Development of cardiac computed tomography for evaluation of aortic valve stenosis. Tomography, 11(6), 62.
Blood flow analysis with computational fluid dynamics in the left atrium after left atrial plication: a prospective study
Abstract
This study aimed to evaluate blood flow stagnation in an enlarged left atrium (LA) and to determine whether left atrial plication (LAP) could alleviate blood flow stagnation.
PDF
Target/Research Design
Target
Five patients with chronic atrial fibrillation who underwent mitral valve surgery followed by LAP for an enlarged LA (≥60 mm in diameter) were included.
Research Design
CFD analysis was performed using preoperative and postoperative computed tomography and four-dimensional flow magnetic resonance imaging.In addition, computer graphics were used to create virtual left atrial appendage resection (LAAR) models.
Hemodynamic analysis
Blood flow stagnation in the LA was assessed using CFD analysis in three groups: preoperative, virtual LAAR, and LAP.
Results
When both average and constant stagnation volumes were normalized to 100 preoperatively, the LAP group demonstrated significantly lower average and constant stagnation volumes than the LAAR group.
Discussion
Blood flow stagnation was observed in both the left atrial appendage and the enlarged left atrium. CFD analysis demonstrated that LAP improved blood flow stagnation more effectively than virtual LAAR alone.
Conclusion
CFD analysis revealed that LAP significantly reduced blood flow stagnation in the enlarged left atrium and may be an effective strategy for improving LA hemodynamics.
Reference
Enomoto, T., Mishima, T., & Tsuchida, M. (2024). Blood flow analysis with computational fluid dynamics in the left atrium after left atrial plication: A prospective study. General Thoracic and Cardiovascular Surgery, 72(4), 209–215.