Energy loss (EL) in blood flow analysis
By analyzing blood flow, we can gain insight into flow behavior, pressure distribution, velocity patterns, and energy loss, which have critical applications in both medical and engineering fields. However, many technical terms may be difficult to ask about. This time, we’ll focus on explaining energy loss, one of the key concepts in understanding how blood moves through vessels and the potential implications for cardiovascular health.
What is energy loss
It represents the energy loss, as well as the conversion to heat and sound, that occurs when blood flows through the vessels. This measure was originally calculated to evaluate valve stenosis and efficiency.
Causes of increased energy loss include
<Viscous friction>
The value becomes higher when the blood viscosity is high or when the flow velocity is large. For example, in areas with stenosis, the flow becomes jet-like as shown in Figure 1. More friction occurs at the stenosis, leading to greater energy loss.
<Turbulent Dissipation>
When there is a lot of turbulence in the blood flow, interactions and friction between fluid particles increase, converting energy into heat and increasing energy loss. In Figure 1, turbulence occurs when the blood flow suddenly widens after passing through the stenosis, resulting in greater energy loss.
<Deofrmation of vessel walls>
Changes in the diameter or shape of the blood vessels, or the presence of branching points, disturb the smooth laminar flow of blood, leading to flow separation and disturbances in the profile. These changes result in increased energy loss.
Figure 1
Calculation of energy loss
Energy loss can be calculated in a specific section of a blood vessel from the difference in total pressure between the inlet and the outlet. In other words, to calculate energy loss, pressure information is required. Currently, three methods of analysis are available, depending on imaging conditions and the target being imaged.
*1: It depends on the imaging conditions and the object to be imaged. The analysis of small caliber vessels tends to be less accurate due to motion artifacts from beating and breathing around cardiovascular vessels.
*2: Vessels other than those indicated above may also be analyzed.
<Computational Fluid Dynamics:CFD>
It can be derived from contrast-enhanced CT and body surface area data in pediatric cases. In simulations using CFD, energy loss can be calculated using relative pressure values. Vessel size is determined by shape-specific data, but there are no limitations in idealized models. Additionally, only vessels with minimal deformation that impact the flow can be measured.
<4D Flow MRI>
4D Flow MRI data is required. Depending on the target and imaging conditions, vessels with a diameter of 5 mm or larger are generally preferred. As this is an actual measurement, invasive catheter-based measurements are required. However, a method has been developed that allows for calculations from flow velocity using fluid dynamics equations related to viscous dissipation.
Colored Doppler data exported in HDF5 format (*.h5) from GE's Vivid series workstations is required. There are no limitations on vessel size or movement, but similar to 4D Flow MRI, invasive catheter-based measurements or methods utilizing viscous dissipation equations are required due to the need for actual measurements.
Medical Application
Energy loss is used as a parameter for postoperative evaluation in Fontan procedures, predicting left ventricular function after aortic valve replacement, and assessing the severity of aortic valve regurgitation.
Practical cases
Case 1.
This research was conducted to evaluate whether energy loss contributes to predicting left ventricular function after Aortic Valve Replacement (AVR). The study involved nine AVR patients using bioprosthetic valves. Among the 9 patients, a porcine bioprosthesis was used on 5 patients and a bovine pericardial bioprosthesis was used on 4 patients. 4D Flow MRI was used to visualize aortic flow patterns, and the energy loss (EL), cardiac output (CO), and total EL/CO ratio were calculated.
In porcine bioprosthesis, severe spiral flow was observed in the ascending aorta over the entire systolic period. In contrast, in bovine pericardial bioprosthesis, linear retrograde aortic flow was observed during early systole, and after mid-systole, significant vortex flow occurred in both the wide and narrow portions of the ascending aorta. The total EL/CO ratio was strongly correlated with improved left ventricular rate after AVR (r = 0.74, P = 0.02) Throughout this study, aortic flow patterns were different in porcine and bovine pericardial bioprostheses. The total EL/CO ratio is also a useful tool to assess improvement in left ventricular rate after AVR, and optimization of the total EL/CO ratio may improve hemodynamic performance after AVR.
Hohri Y, Itatani K, Numata S, et al. Blood flow energy loss: a predictor for the recovery of left ventricular function after bioprosthetic aortic valve replacement. Interactive CardioVascular and Thoracic Surgery. 2021;33(3):339-347. doi:10.1093/icvts/ivab094
Case 2.
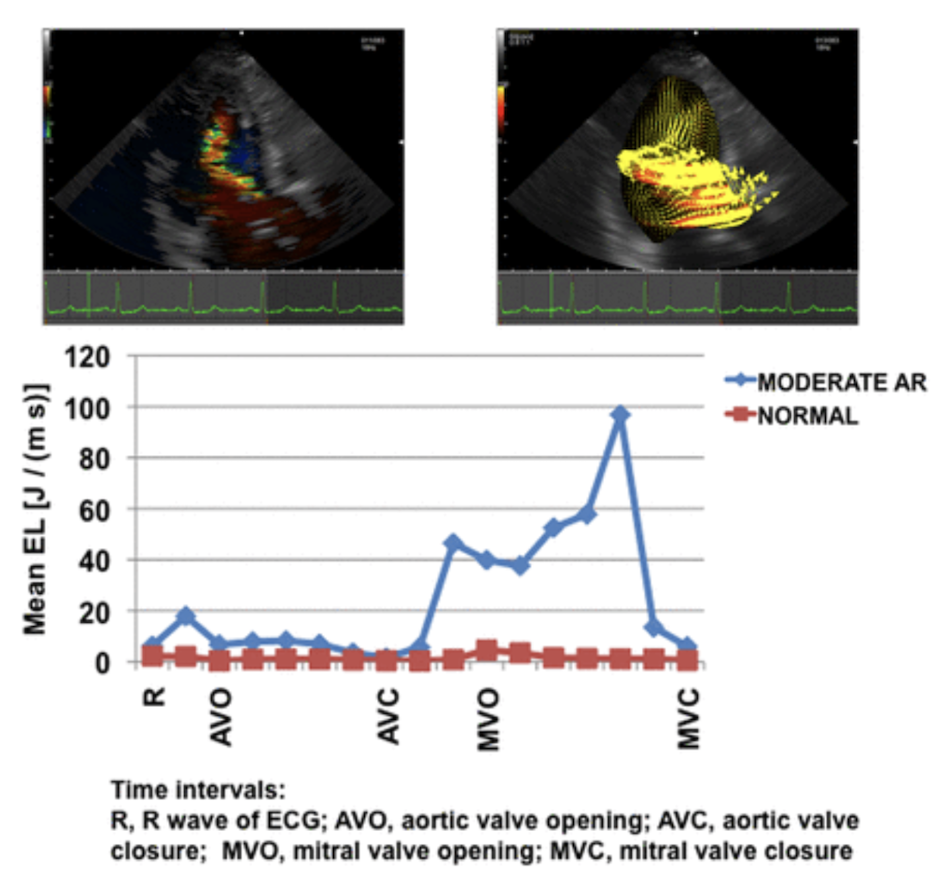
A study evaluated whether energy loss is predictive of heart failure in aortic regurgitation (AR). In 11 anesthetized open chest dogs, AR was induced by deforming the aortic valve with a pigtail catheter. Energy loss was also measured using conventional echocardiography and VFM in 22 patients with AR of varying severity and 12 healthy subjects.
A total of 20 cases of AR were induced in open chest dogs; 11 were mild to moderate and 9 were moderate to severe. When moderate to severe AR was induced, aortic diastolic pressure was significantly reduced. There was also a trend toward decreased aortic systolic pressure and increased pulse pressure. Color Doppler, VFM vector, and EL images showed that diastolic EL increased significantly in proportion to the severity of AR and was also positively correlated with reflux rate (RF) (r = 0.46, P = 0.041). 11 patients had mild to moderate AR and 11 had moderate to severe AR and 11 patients had moderate to severe AR. In the group with moderate to severe AR, there was a significant increase in left ventricular end-diastolic and end-systolic volumes compared to controls. Ejection fraction tended to decrease, but mean AR values were still within normal limits. Consistent with the results of the study in dogs, higher EL was clearly demonstrated along with AR jets. Diastolic EL was significantly higher in AR compared to the normal group and increased with AR severity (P = 0.001).
Stugaard M, Koriyama H, Katsuki K, et al. Energy loss in the left ventricle obtained by vector flow mapping as a new quantitative measure of severity of aortic regurgitation: a combined experimental and clinical study. European Heart Journal - Cardiovascular Imaging. 2015;16(7):723-730. doi:10.1093/ehjci/jev035
Case 3.
A 70-year-old woman was diagnosed with Stanford type A aortic dissection five years ago and subsequently underwent a total arch replacement surgery using the Frozen Elephant Trunk (FET) technique. After the surgery, she complained of dizziness and general fatigue, and was diagnosed with hemolytic anemia. Laboratory findings showed an elevation in lactate dehydrogenase (LDH) to 832 IU/L, an increased reticulocyte count of 4.1%, and a decrease in haptoglobin to 10 mg/dL. A peripheral blood smear revealed schistocytes, but a Coombs test was negative, and no malignant cells were found in the bone marrow. On physical examination, a systolic murmur was heard at the aortic auscultation point, but transthoracic echocardiography showed no signs of valvular disease or left ventricular hypertrophy.
Enhanced CT and 4D Flow MRI demonstrated that the ascending graft was excessively kinked, leading to high-velocity turbulent blood flow that caused significant energy loss and mechanical damage to red blood cells. It was concluded that the mechanical hemolytic anemia was caused by the kinked graft in the ascending aorta. Instead of a revision of the entire total arch replacement, a less invasive procedure was performed to remove only the kinked section of the graft.
Postoperative enhanced CT findings confirmed that the repaired graft was of appropriate length and had a smooth shape. 4D Flow MRI demonstrated smooth blood flow in the ascending aorta, and a reduction in energy loss in the aortic arch and ascending aorta was observed. In this case, energy loss was used as an indicator of turbulent flow, and it was employed to assess the mechanical hemolytic anemia both before and after the surgery.
Takei Y, Shibasaki I, Suzuki K, Miyazaki S, Hirota S, Ohashi H, Saito S, Fukuda H. Hemolytic anemia caused by an excessively kinked prosthetic graft after total arch replacement detected by 4-dimensional flow magnetic resonance imaging: A case report. Medicine (Baltimore). 2022 Jul 22;101(29):e29617. doi: 10.1097/MD.0000000000029617. PMID: 35866824; PMCID: PMC9302348.
Future prospect of energy loss
Energy loss is expected to remain an important metric in evaluating various diseases. There is a growing expectation toward further researches as in recent reports of using CFD simulations for virtual surgeries or optimal surgical techniques. While predictions and evaluations of postoperative outcomes are currently pretty accurate, long-term prognosis incorporating factors like growth and degeneration still require further research for precise calculations.
https://jspccs.jp/wp-content/uploads/j2601_039.pdf
<Internal link>
Infomration about blood flow analysis, including energy loss is here。
Information about simmulation of surgeries is here.
For those who want to learn more about blood flow analysis/look at actual sample data is here.
<Internal link>
Infomration about blood flow analysis, including energy loss is here。
Information about simmulation of surgeries is here.
For those who want to learn more about blood flow analysis/look at actual sample data is here.